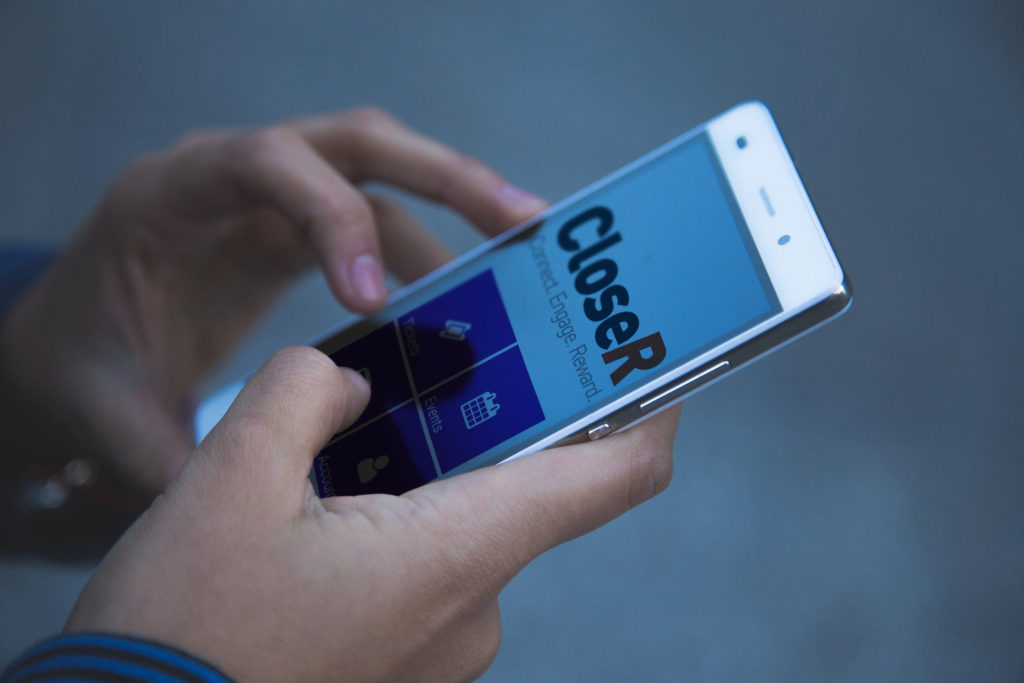
I present here a case study of the CloseR Project, with which I was involved for over two years. It received 1.2m funding from Innovate UK and the Rail Safety and Standards Board.… Read more →
I present here a case study of the CloseR Project, with which I was involved for over two years. It received 1.2m funding from Innovate UK and the Rail Safety and Standards Board.… Read more →
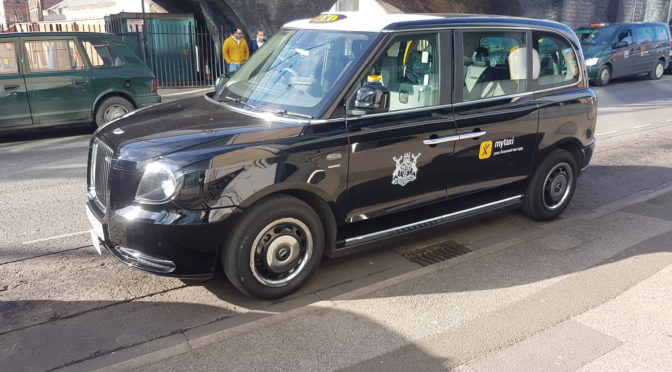
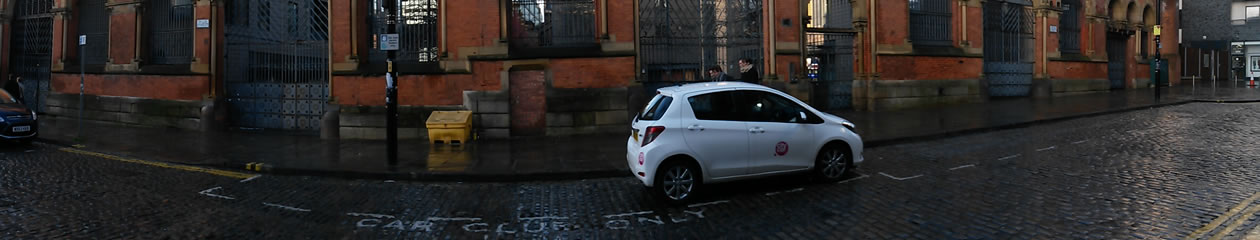
I was working for a project developing innovative charging facilities to solve the shortage of charging stations for electric taxis. Partners included Transport for London (TfL), Nottingham City Council (NCC) and Shell.… Read more →
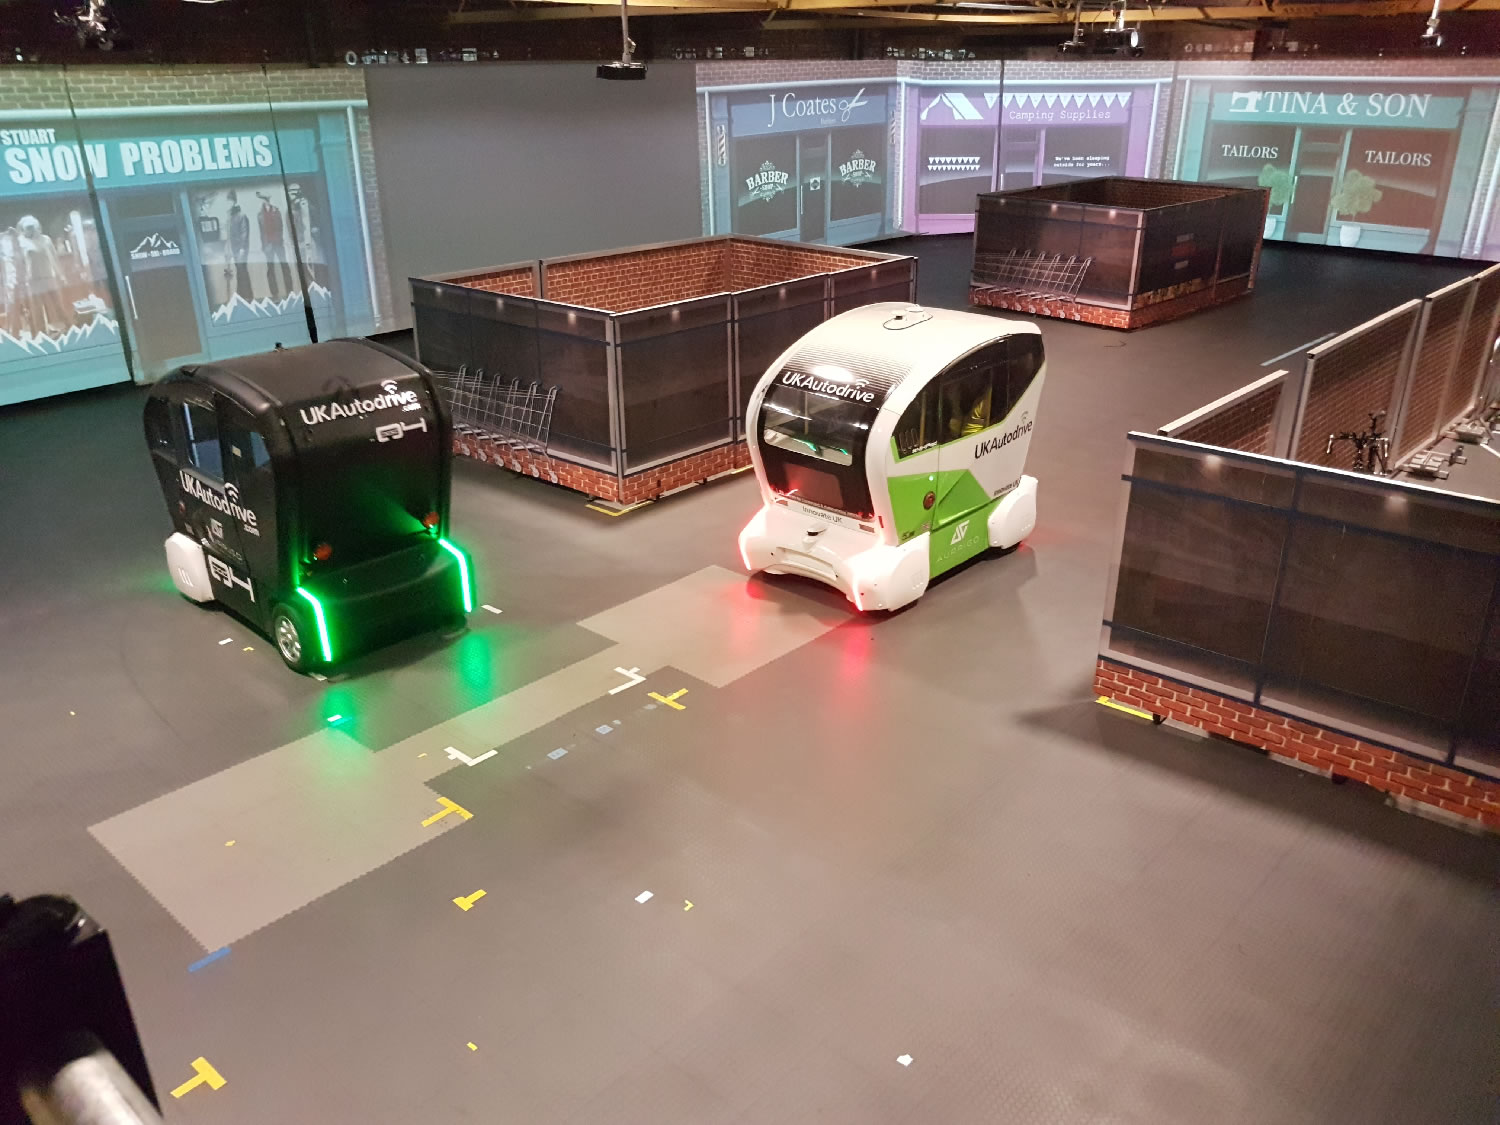
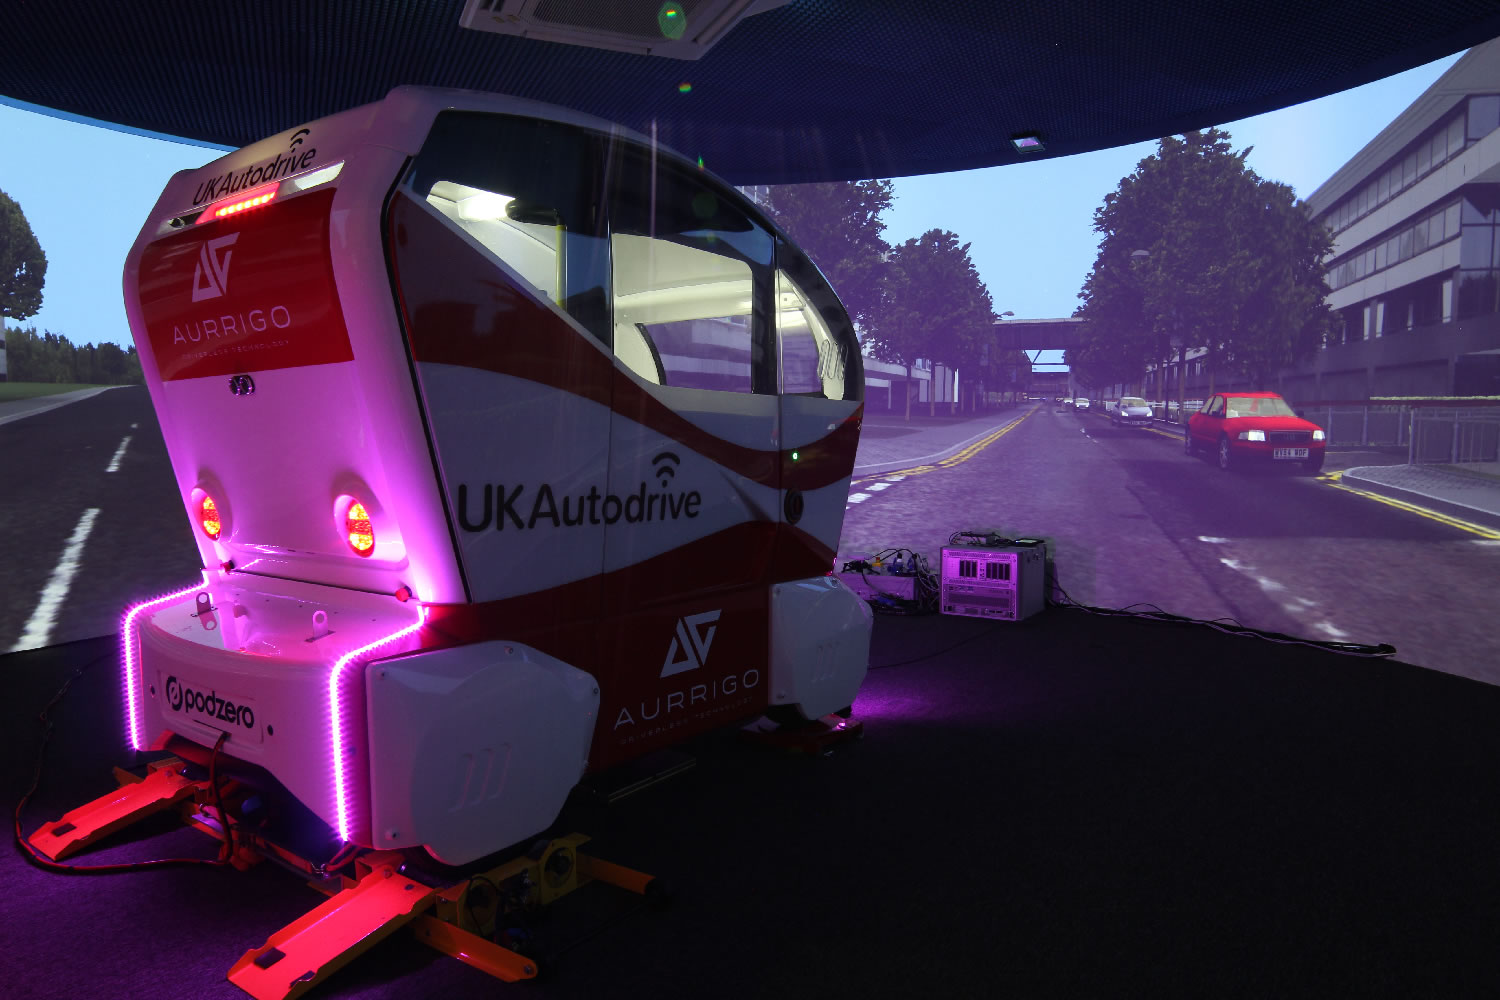
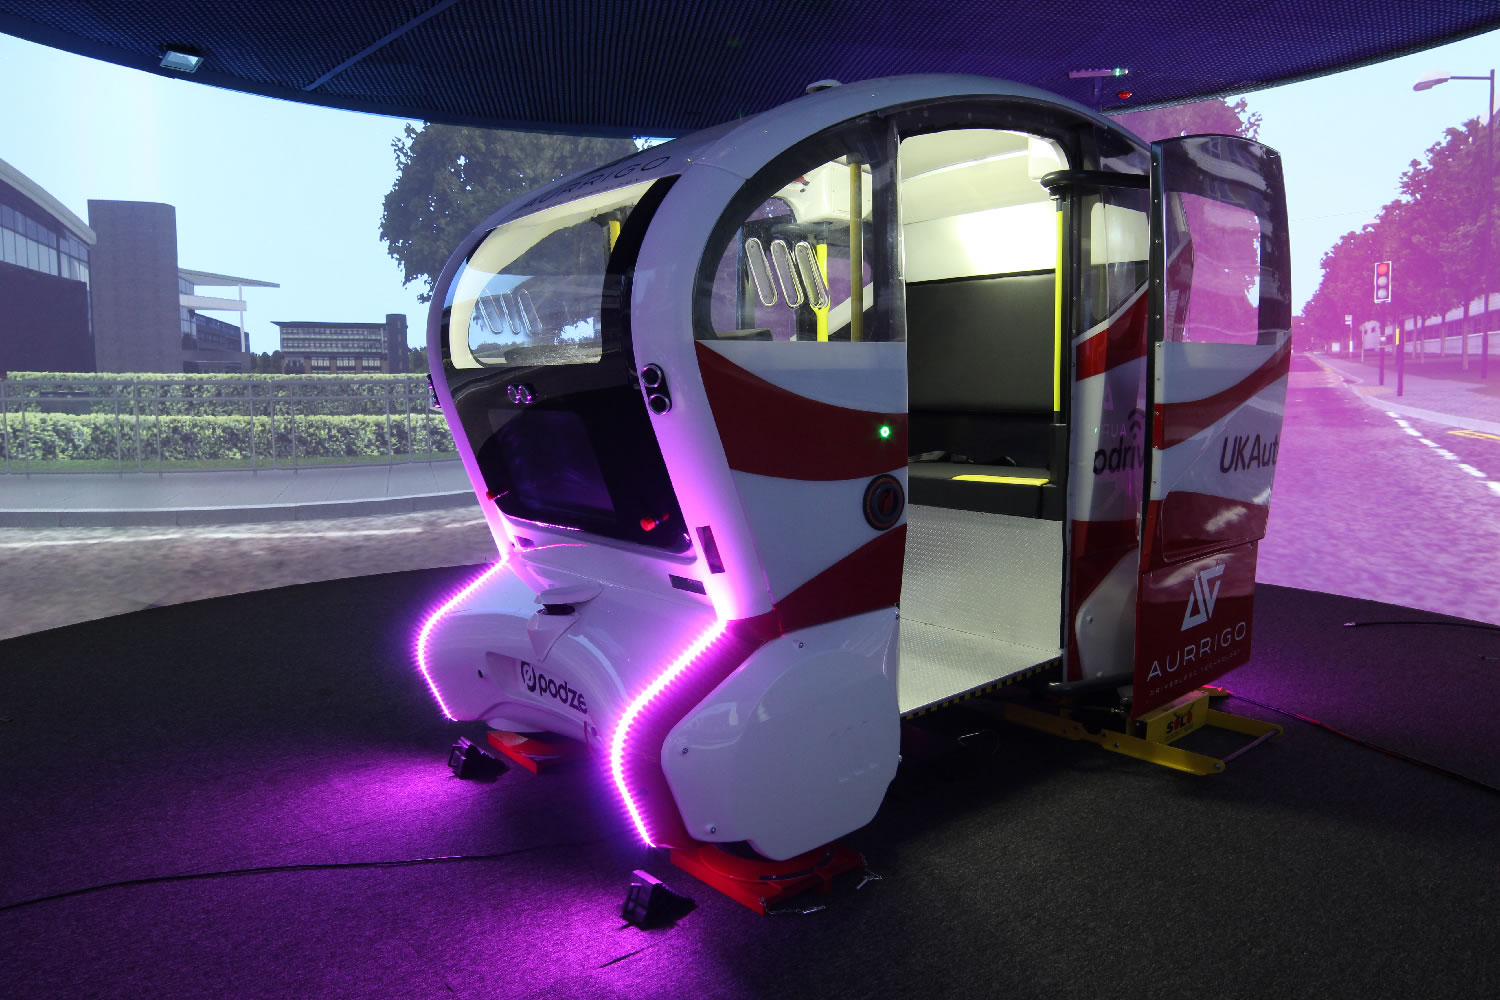
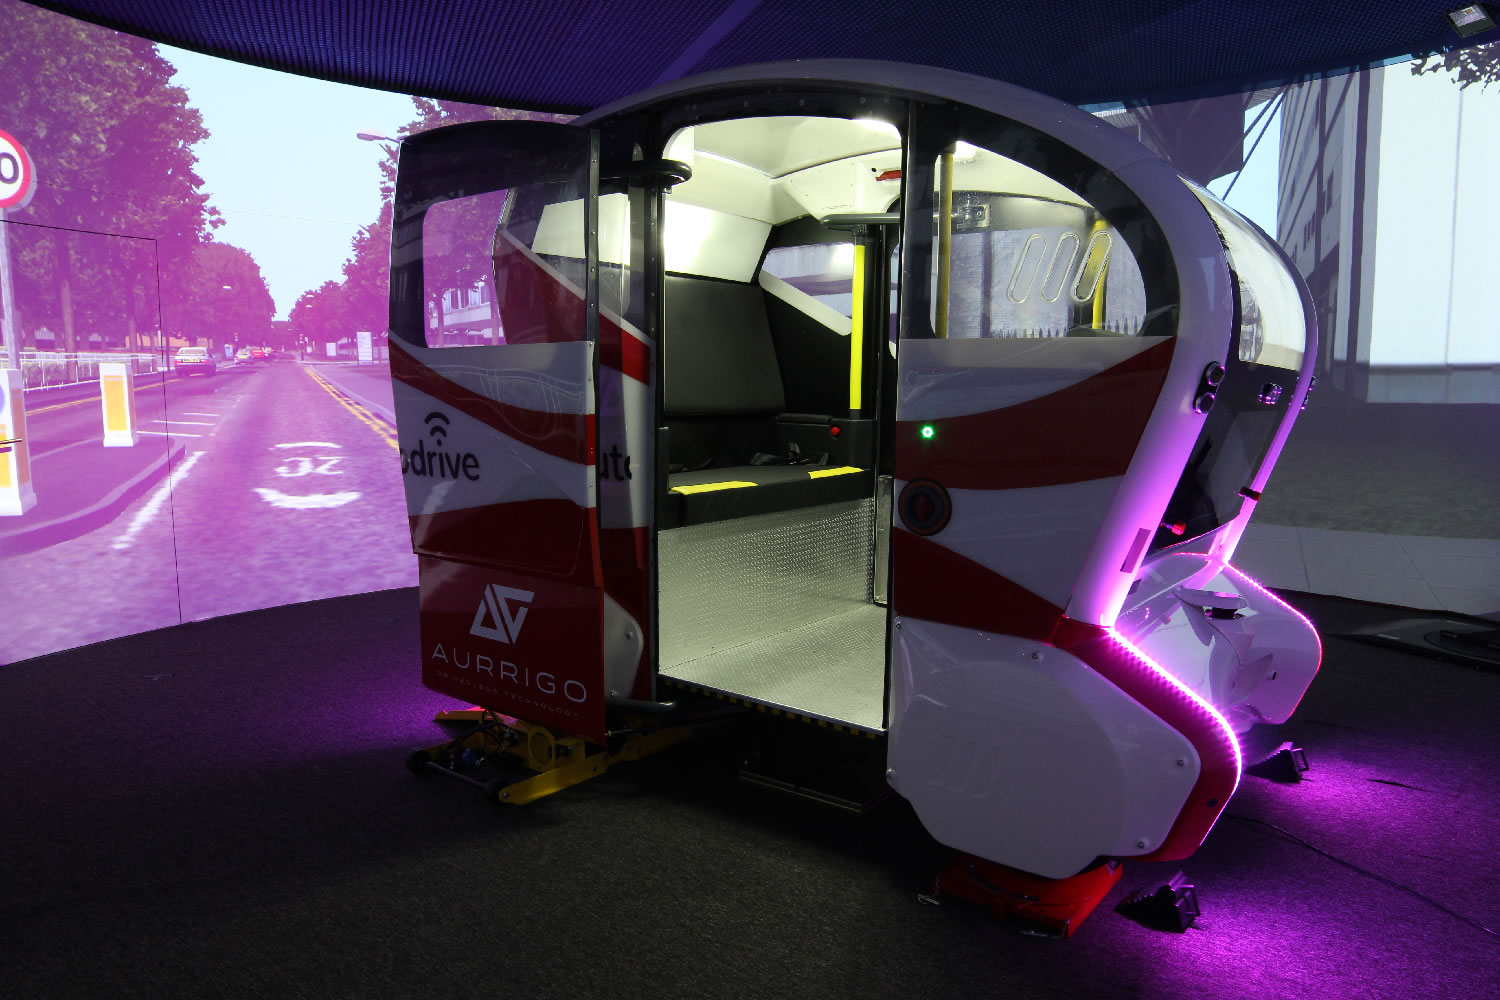

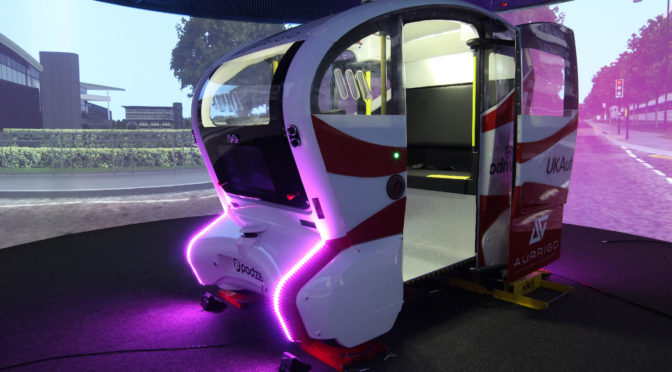
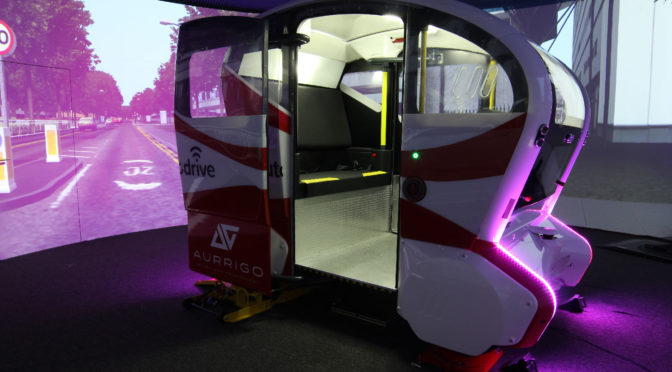
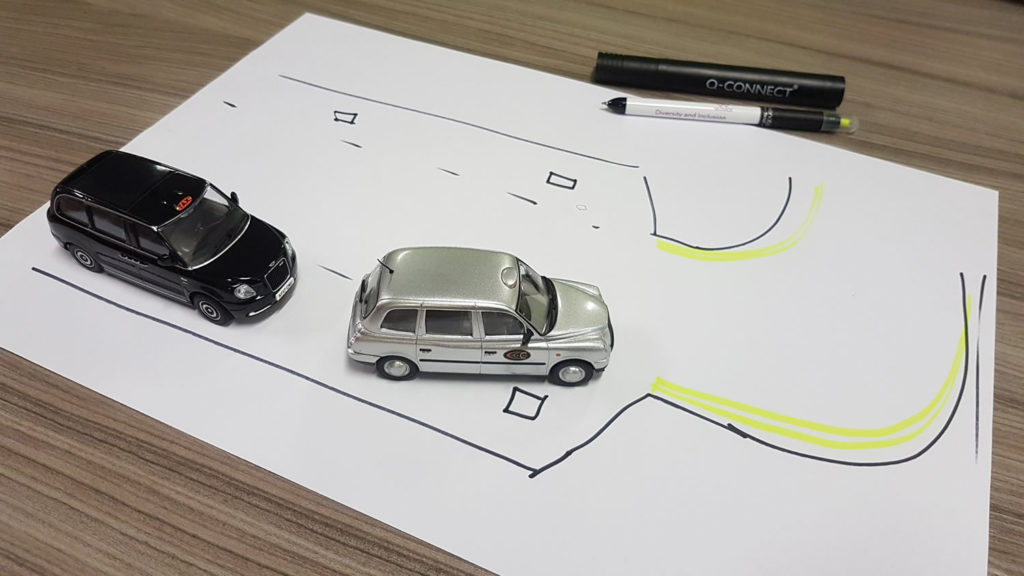
When I was working for the UK Autodrive project I was invited to take pictures of the automated vehicles using during this research. Examples above show my pictures of the vehicles inside the simulator and also within real-world test settings.
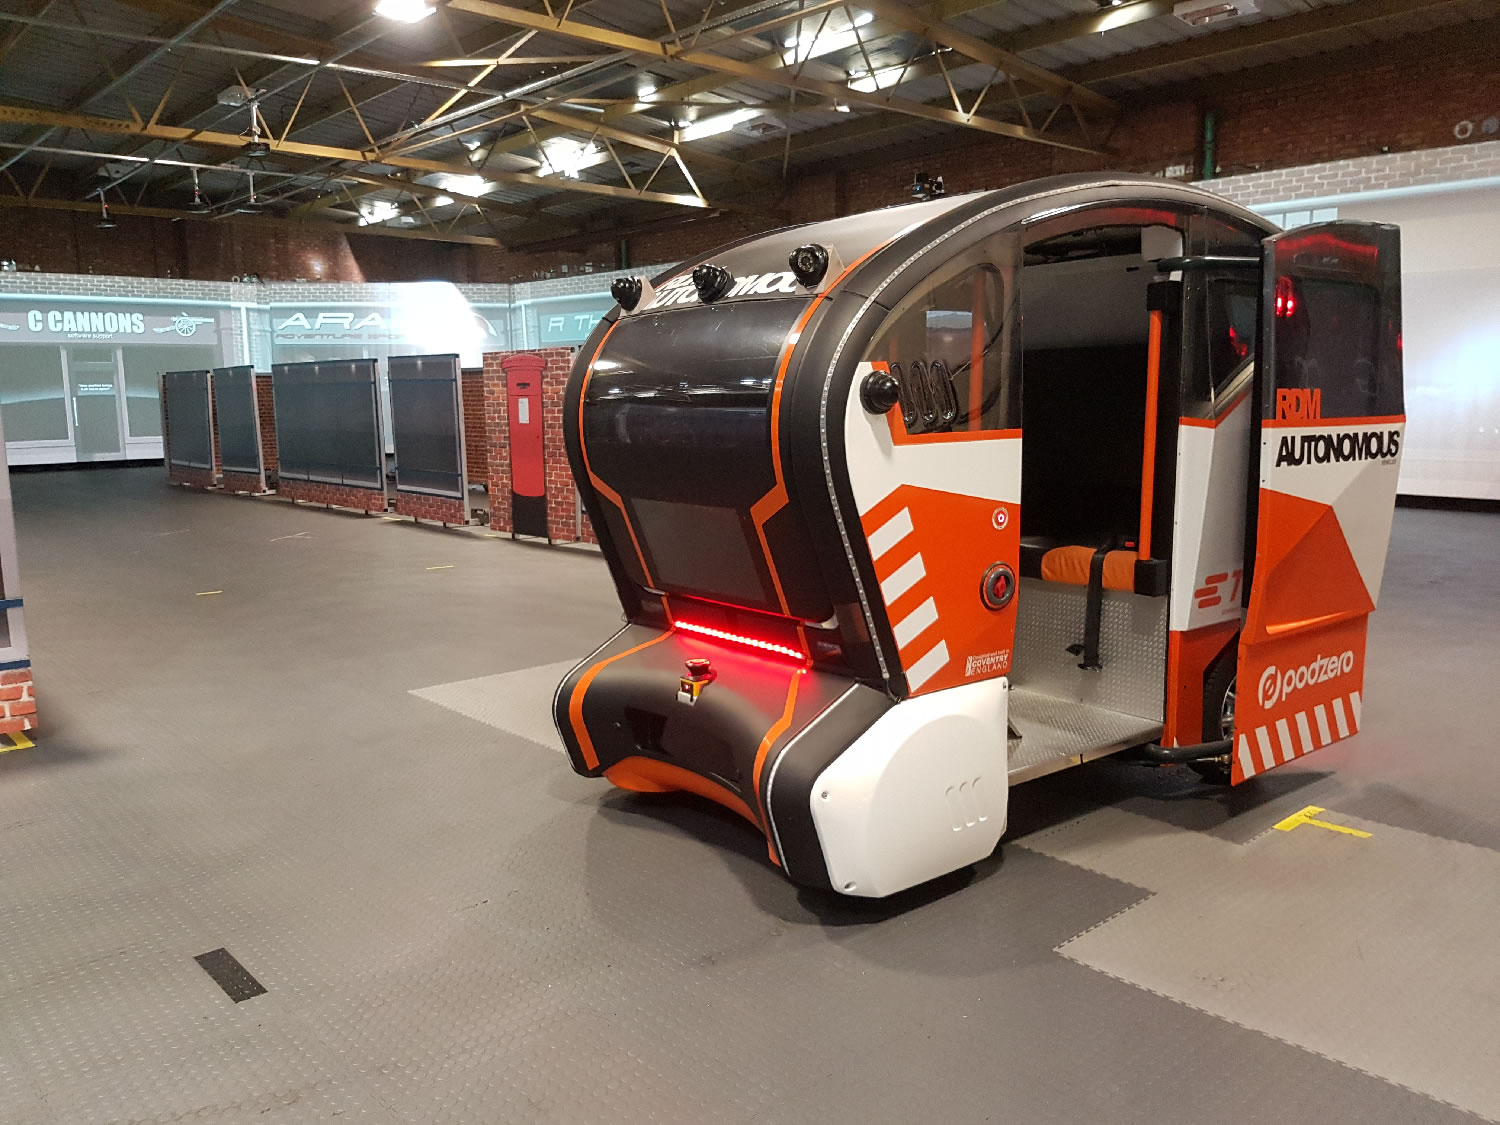
These vehicles are short range, low speed highly automated ‘pods’, manufactured by Aurrigo / RDM. They are designed to provide transportation on the first and last miles of journeys, e.g. from a train station to a town centre, or from … Read more →
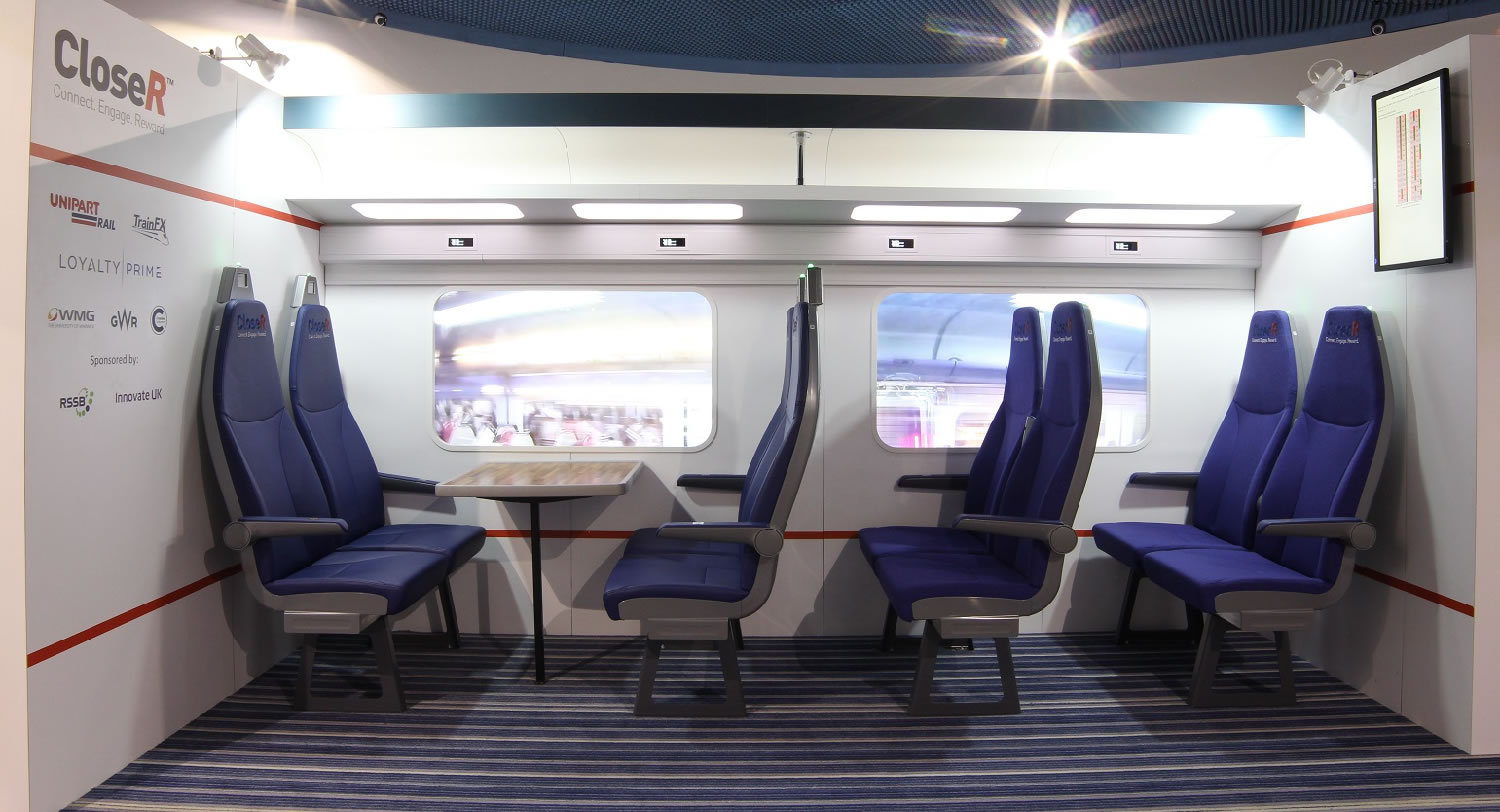
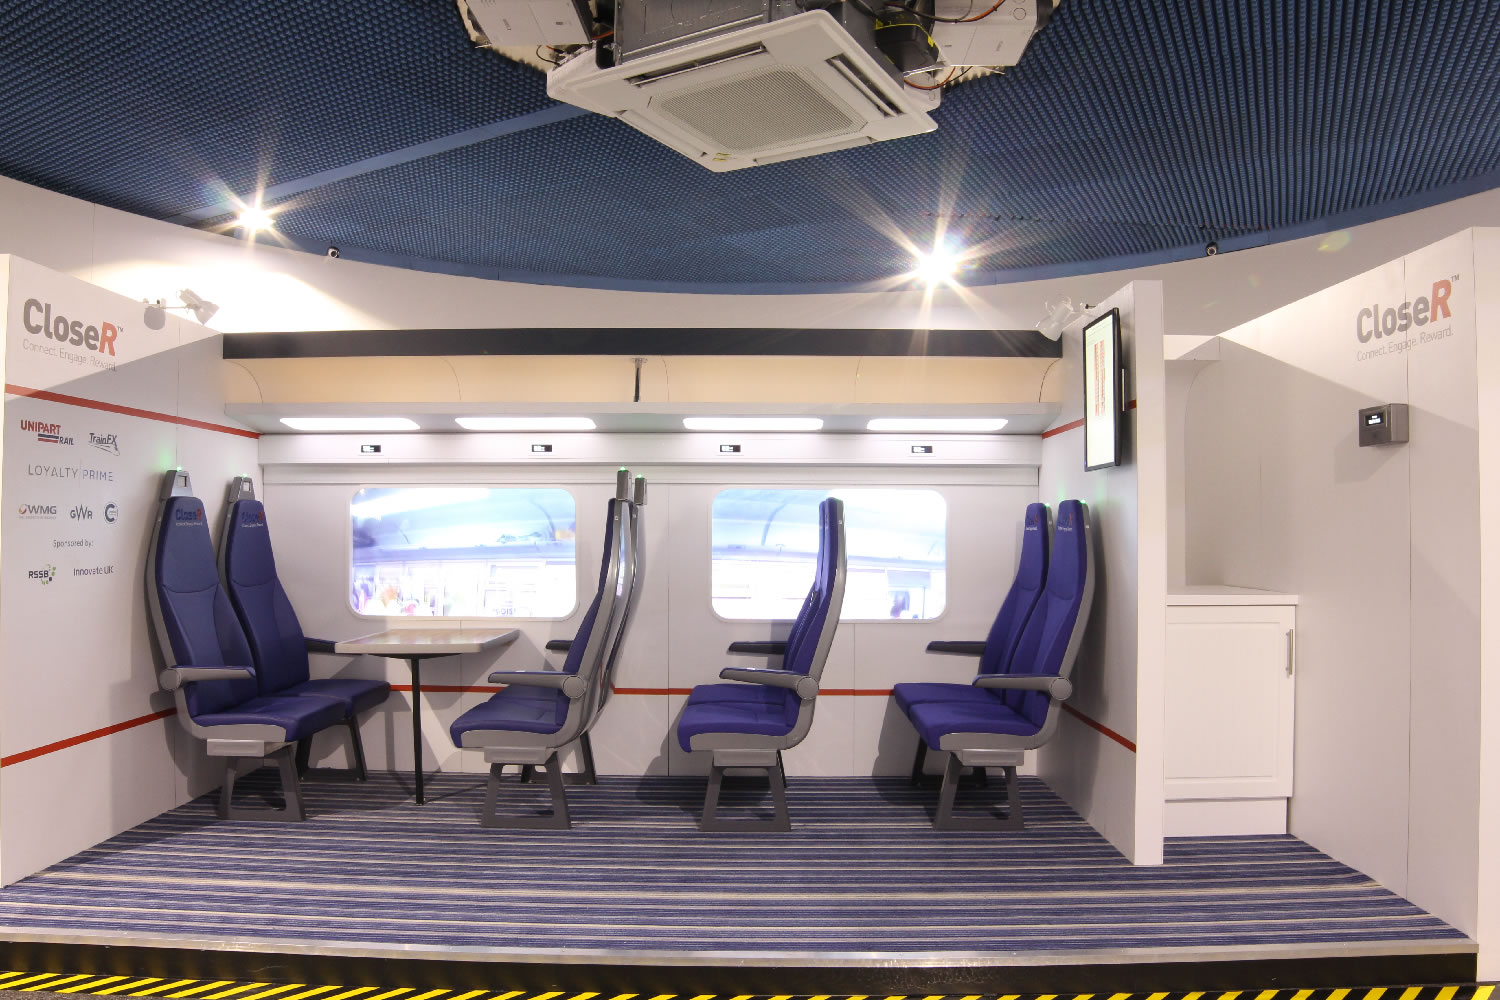
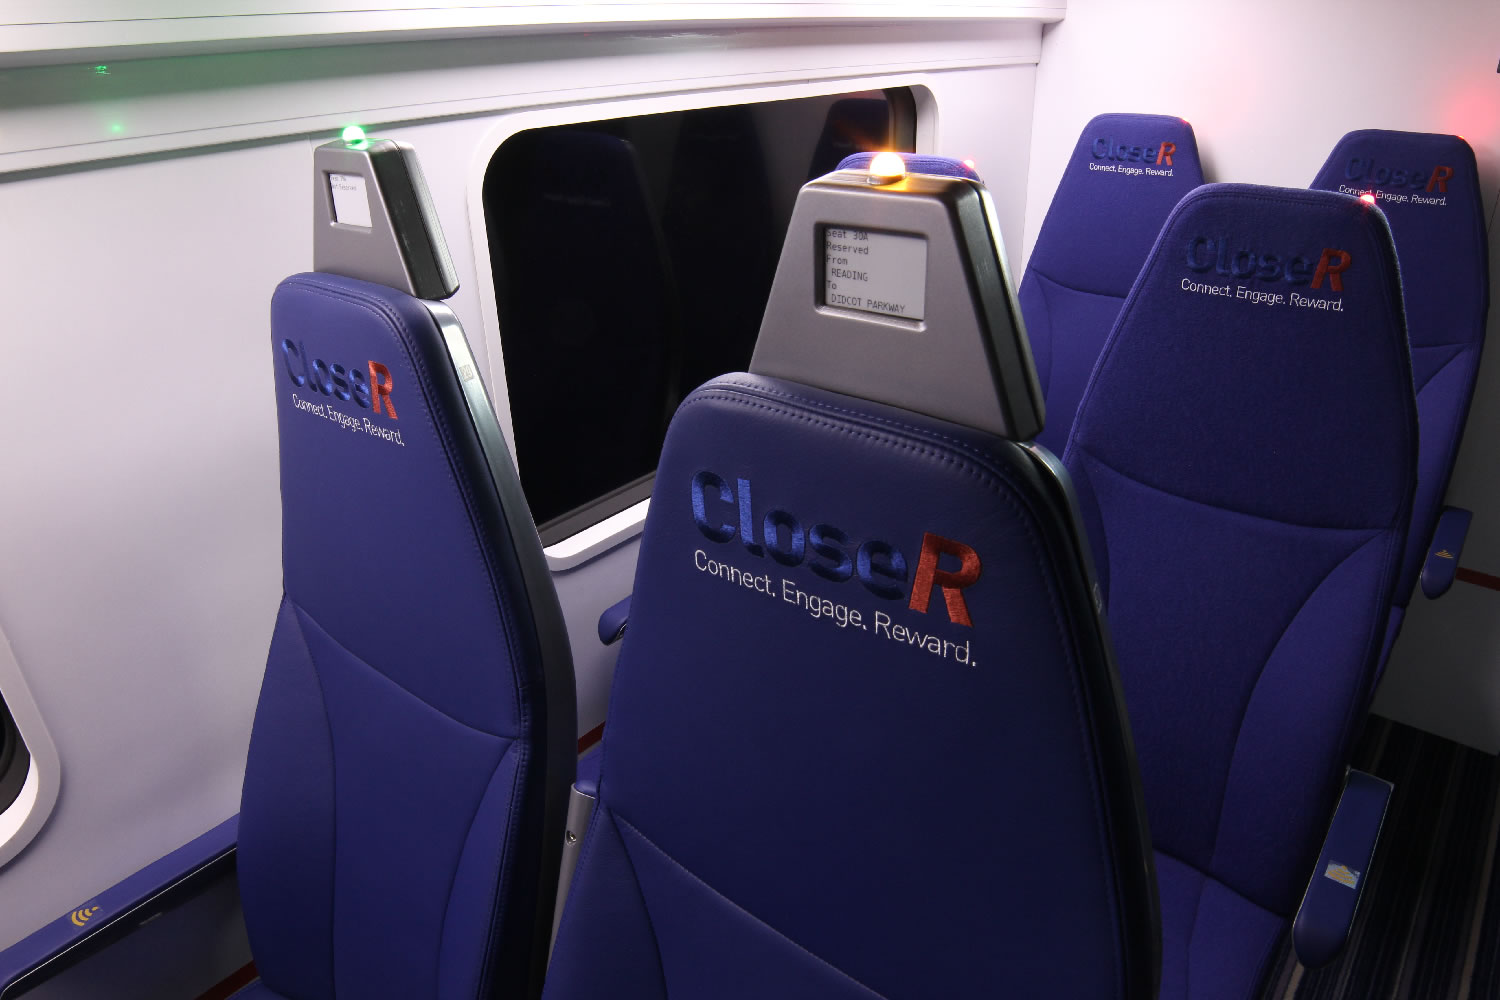
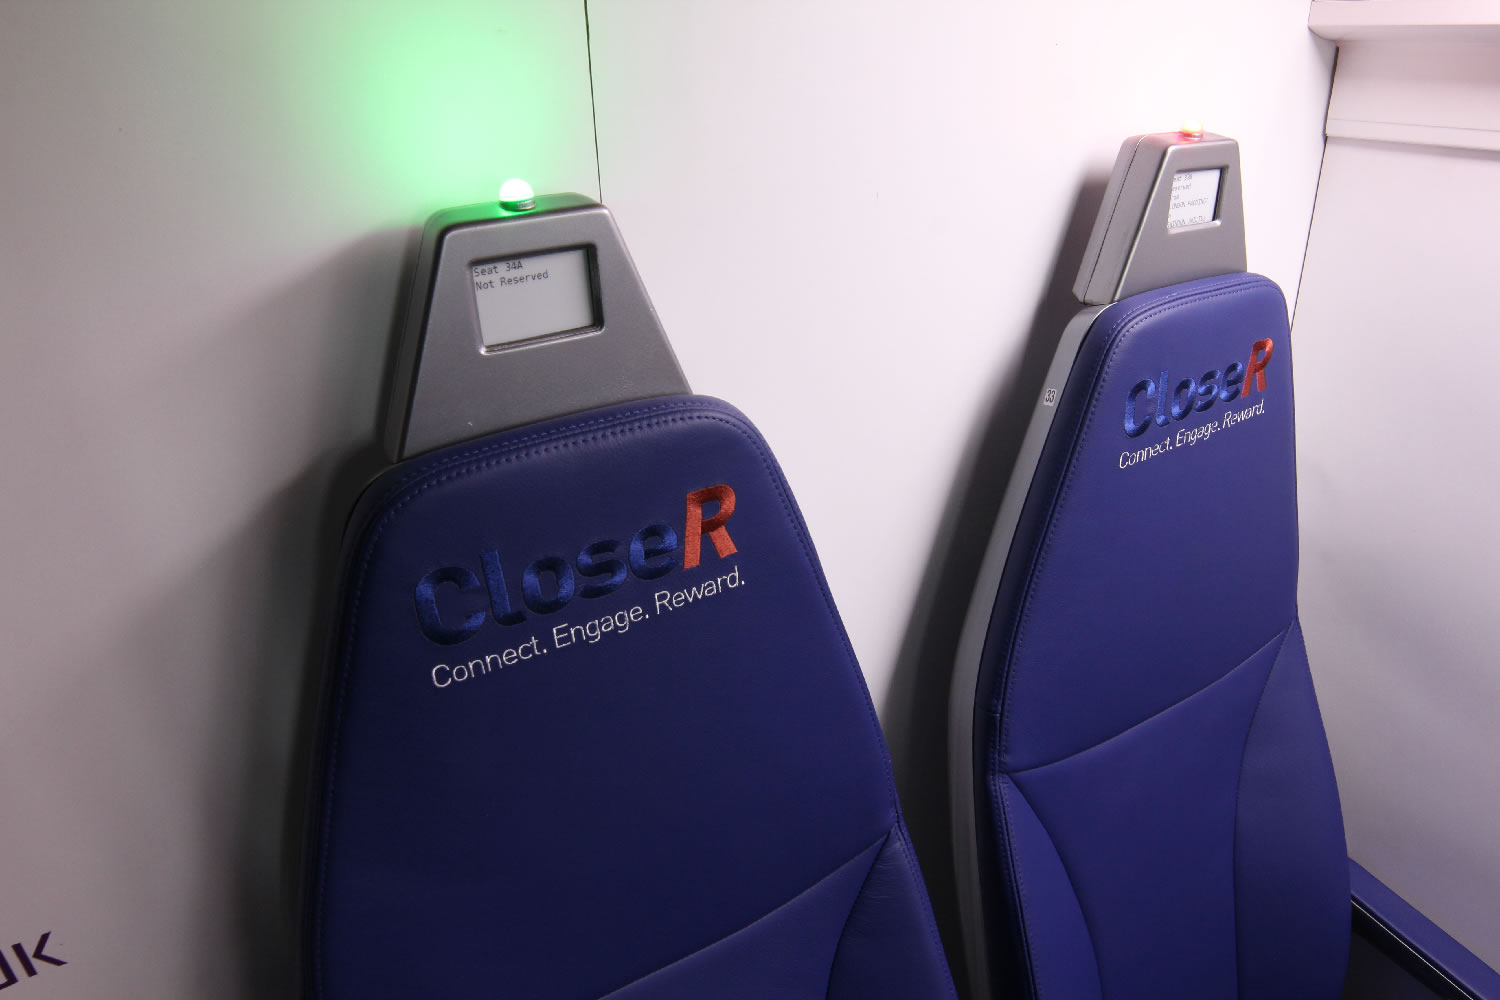
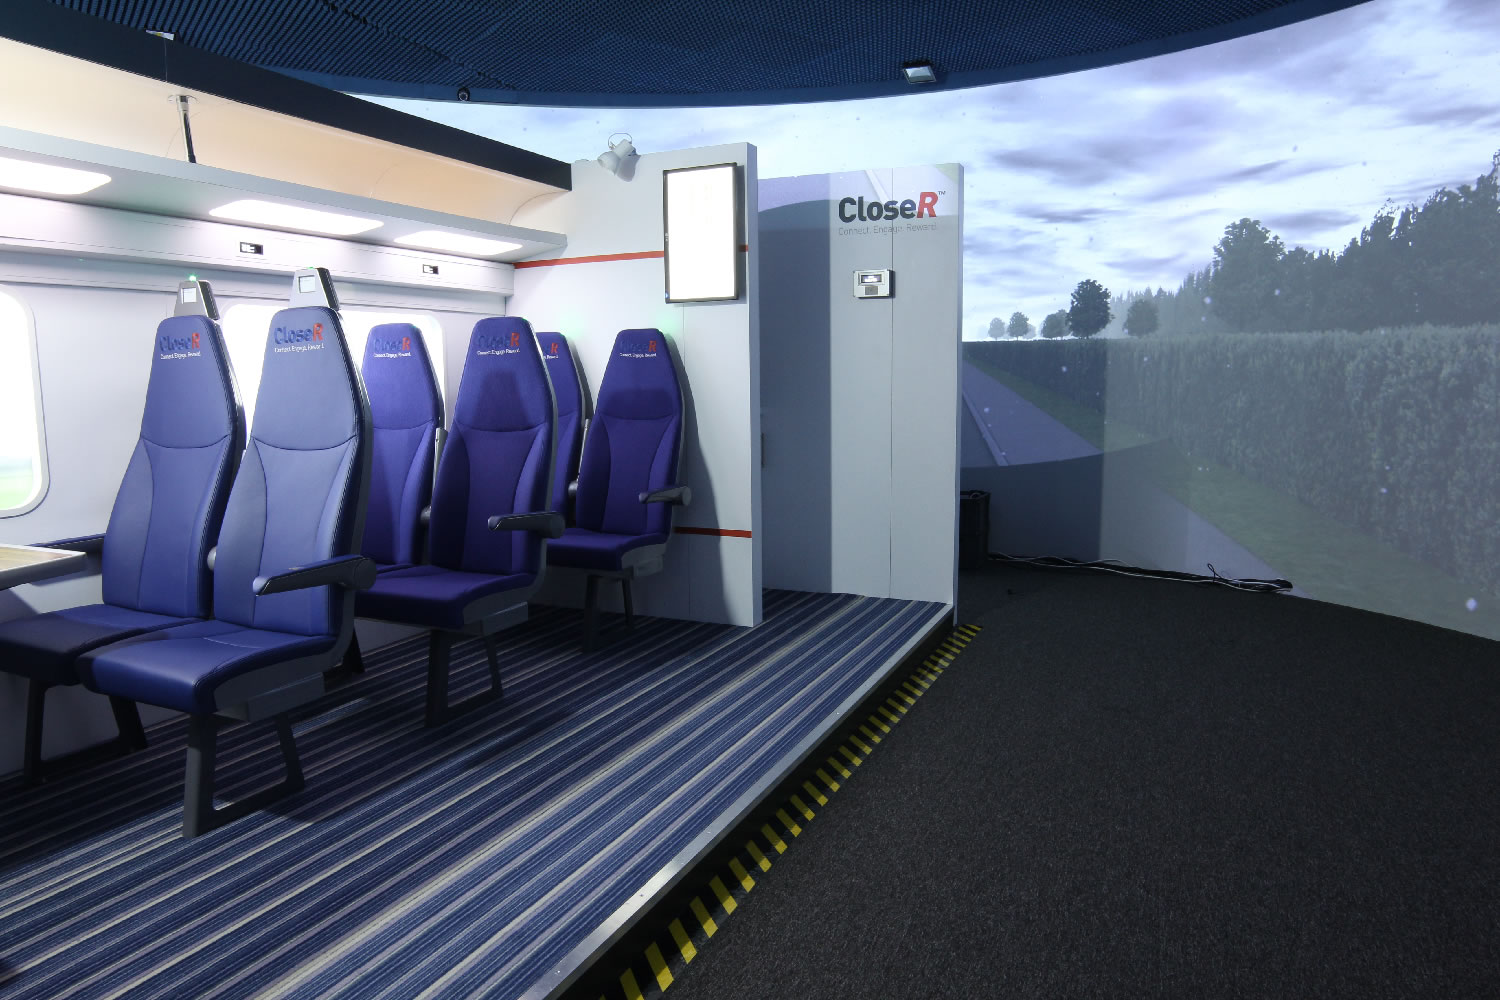
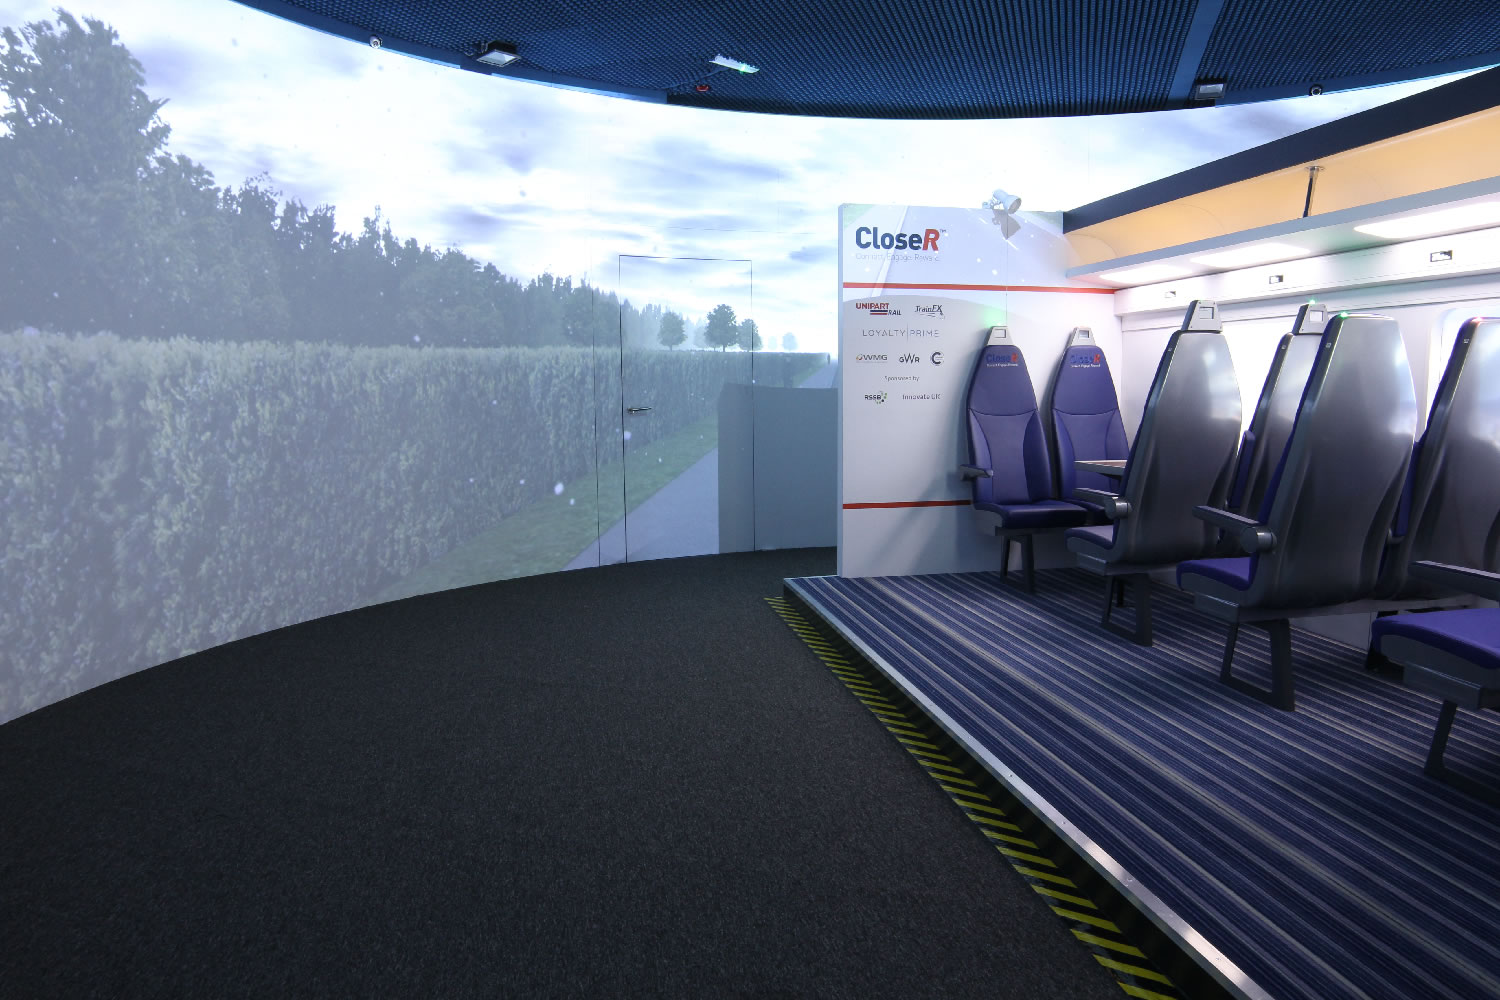
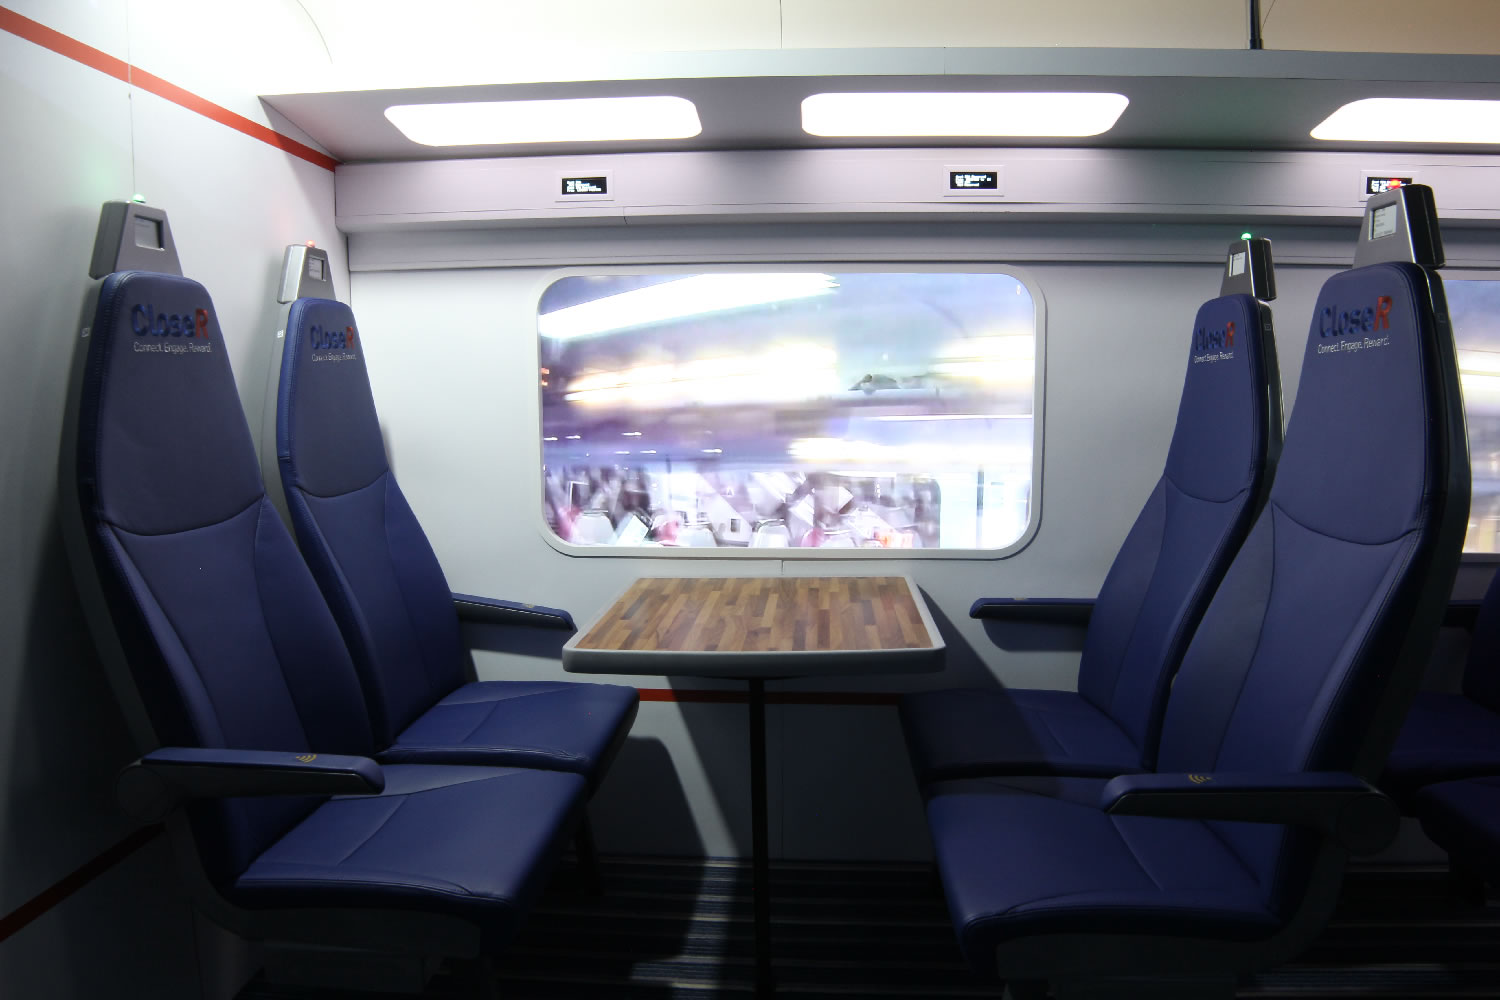
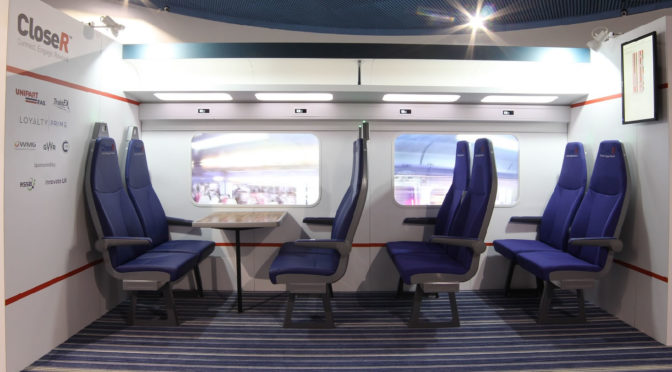
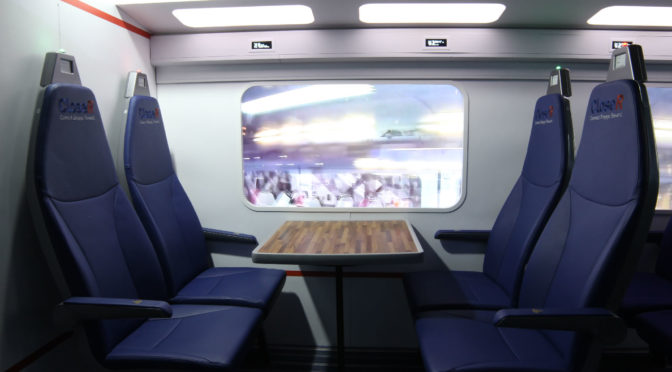
I was invited to take photos of the technology demonstrator created at the end of the CLoSeR project. This prototype is a life-size section of a train carriage containing seats, tables, and the embedded systems developed during the course of the project.
In this occasion the demonstrator was installed inside the WMG 3xD simulator. This location allowed the visual simulation of a train journey with projections on the 360° wall, combined with real video footages displayed on the windows.
This … Read more →

I was one of the UX researchers working for the UK Autodrive, a flagship, multi-partner project studying automated vehicles.… Read more →
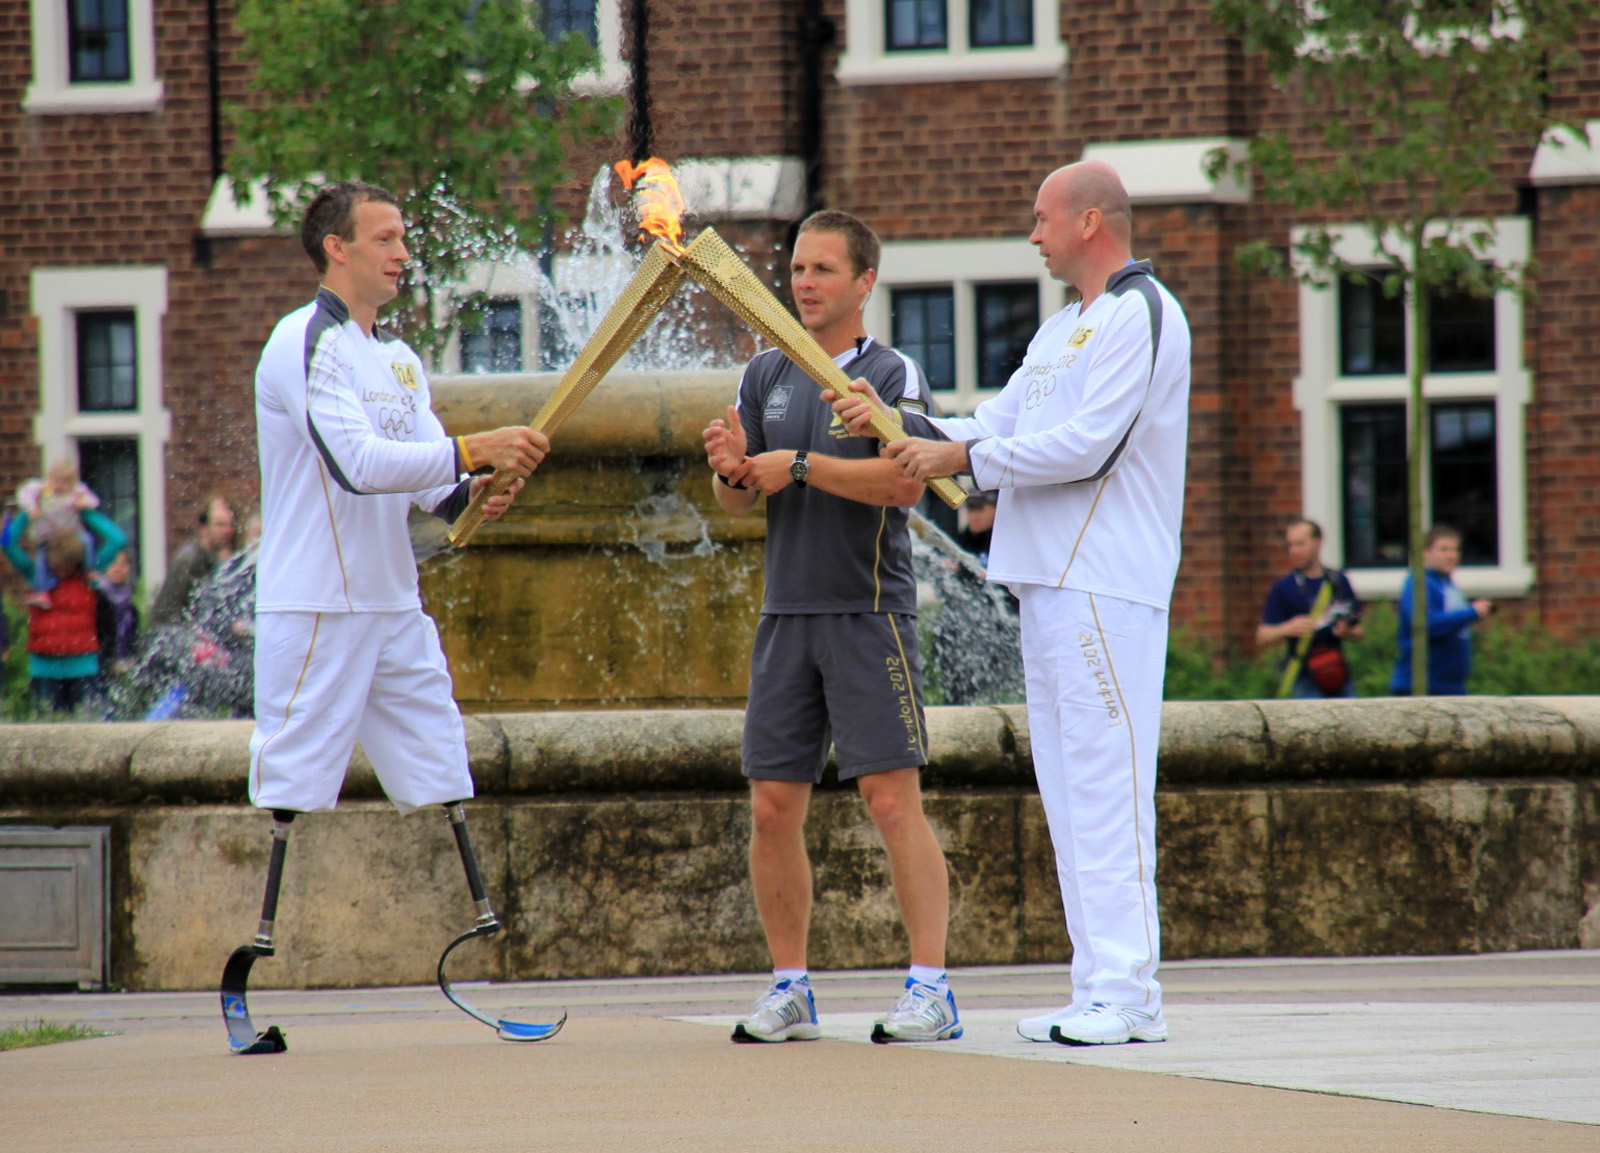
I’ve been playing with different photography techniques and styles, and some of the results can be found below.
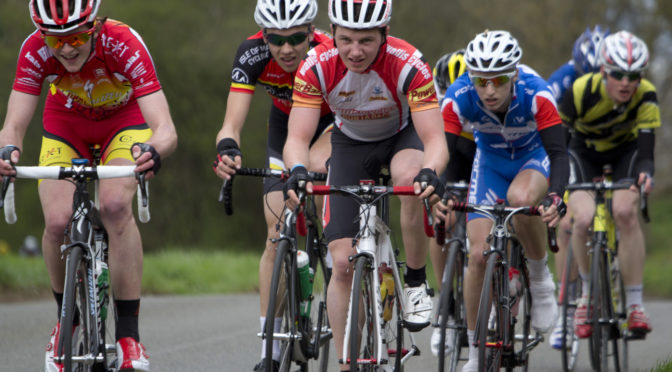
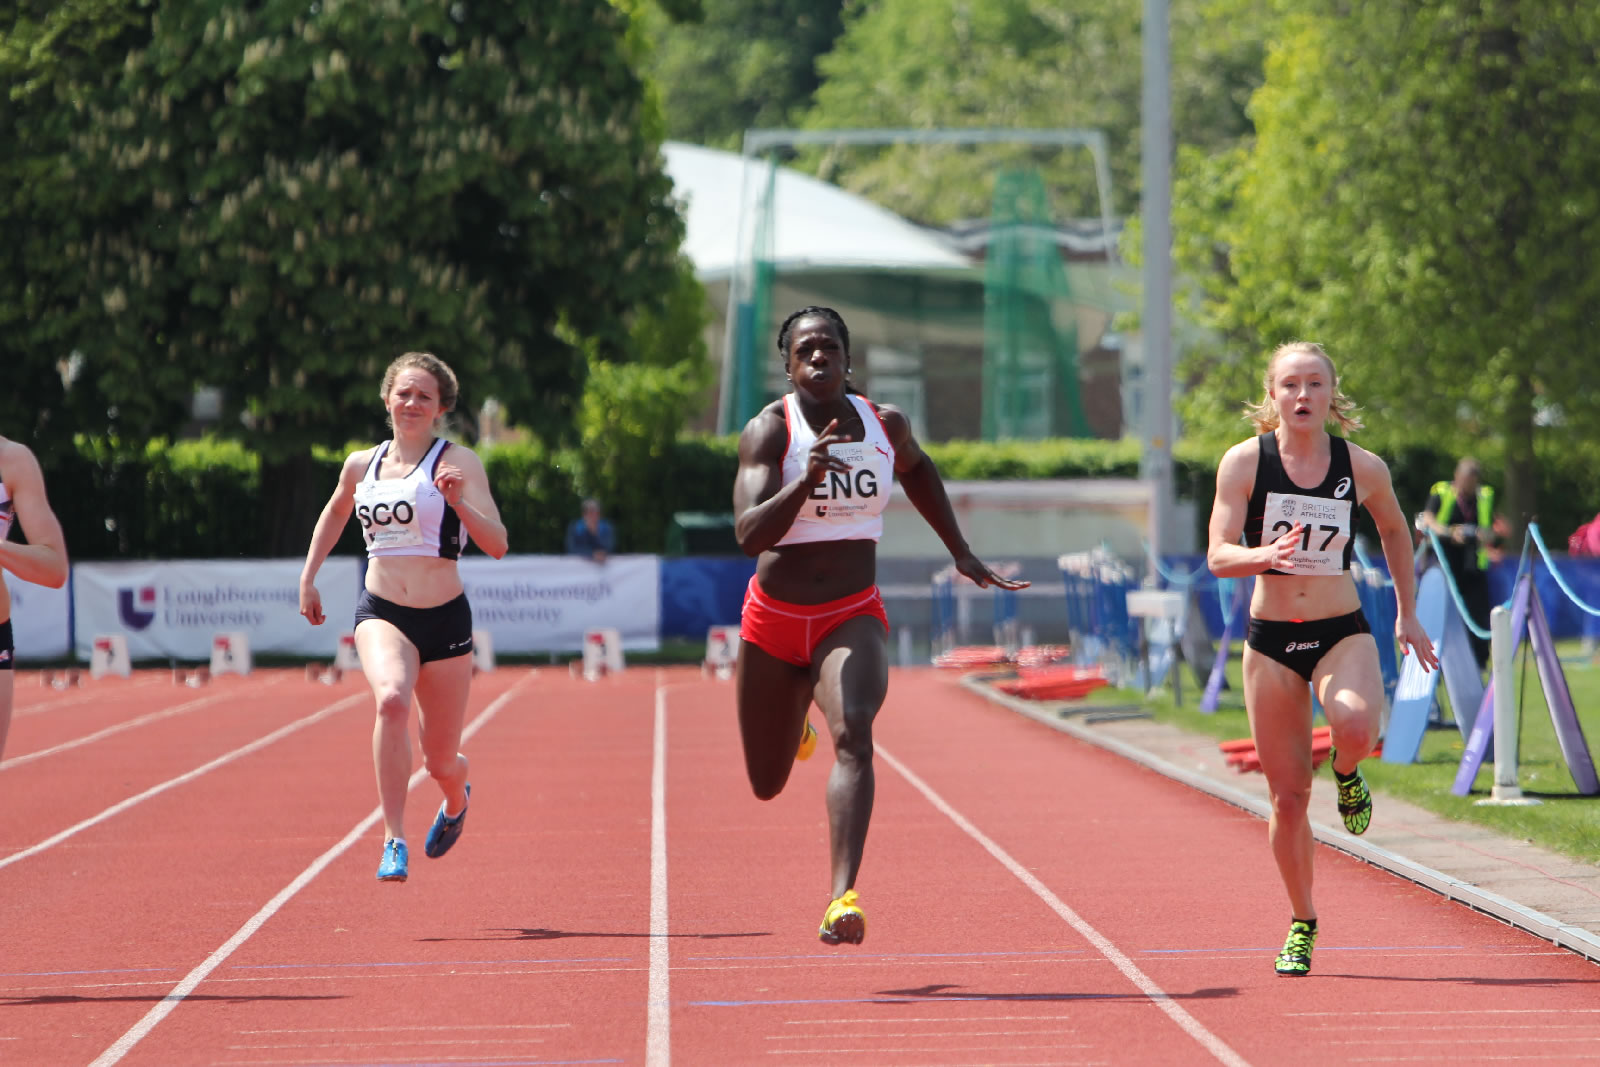
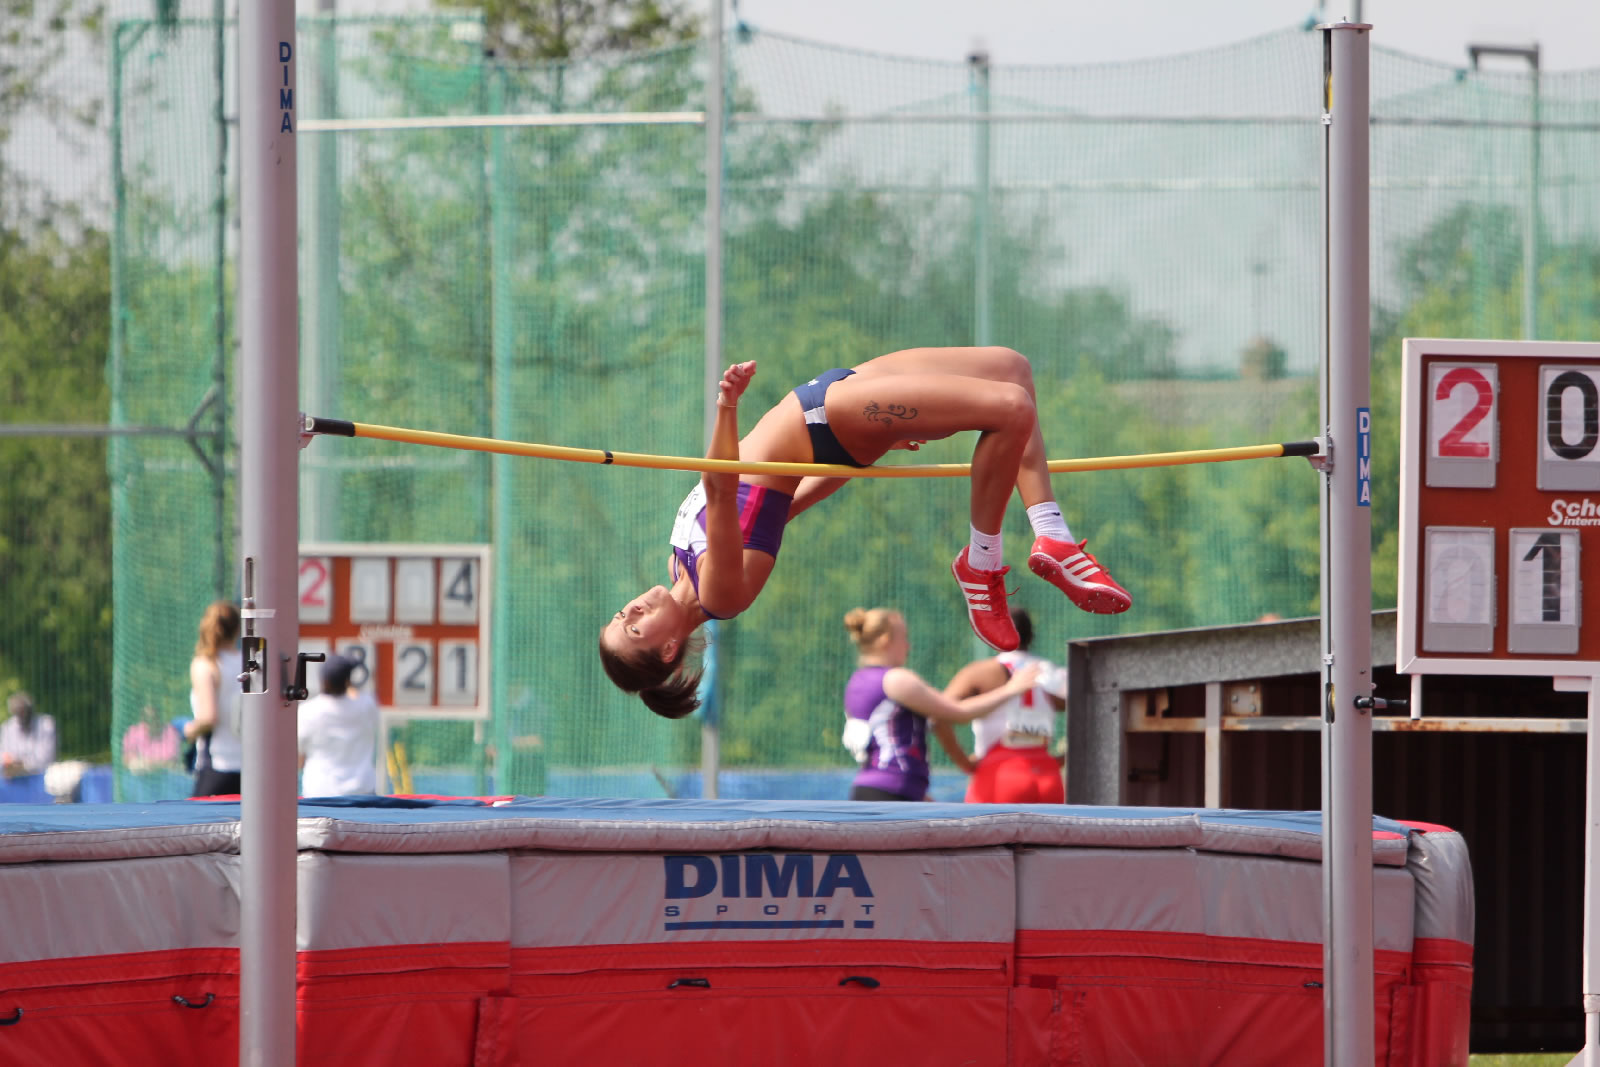
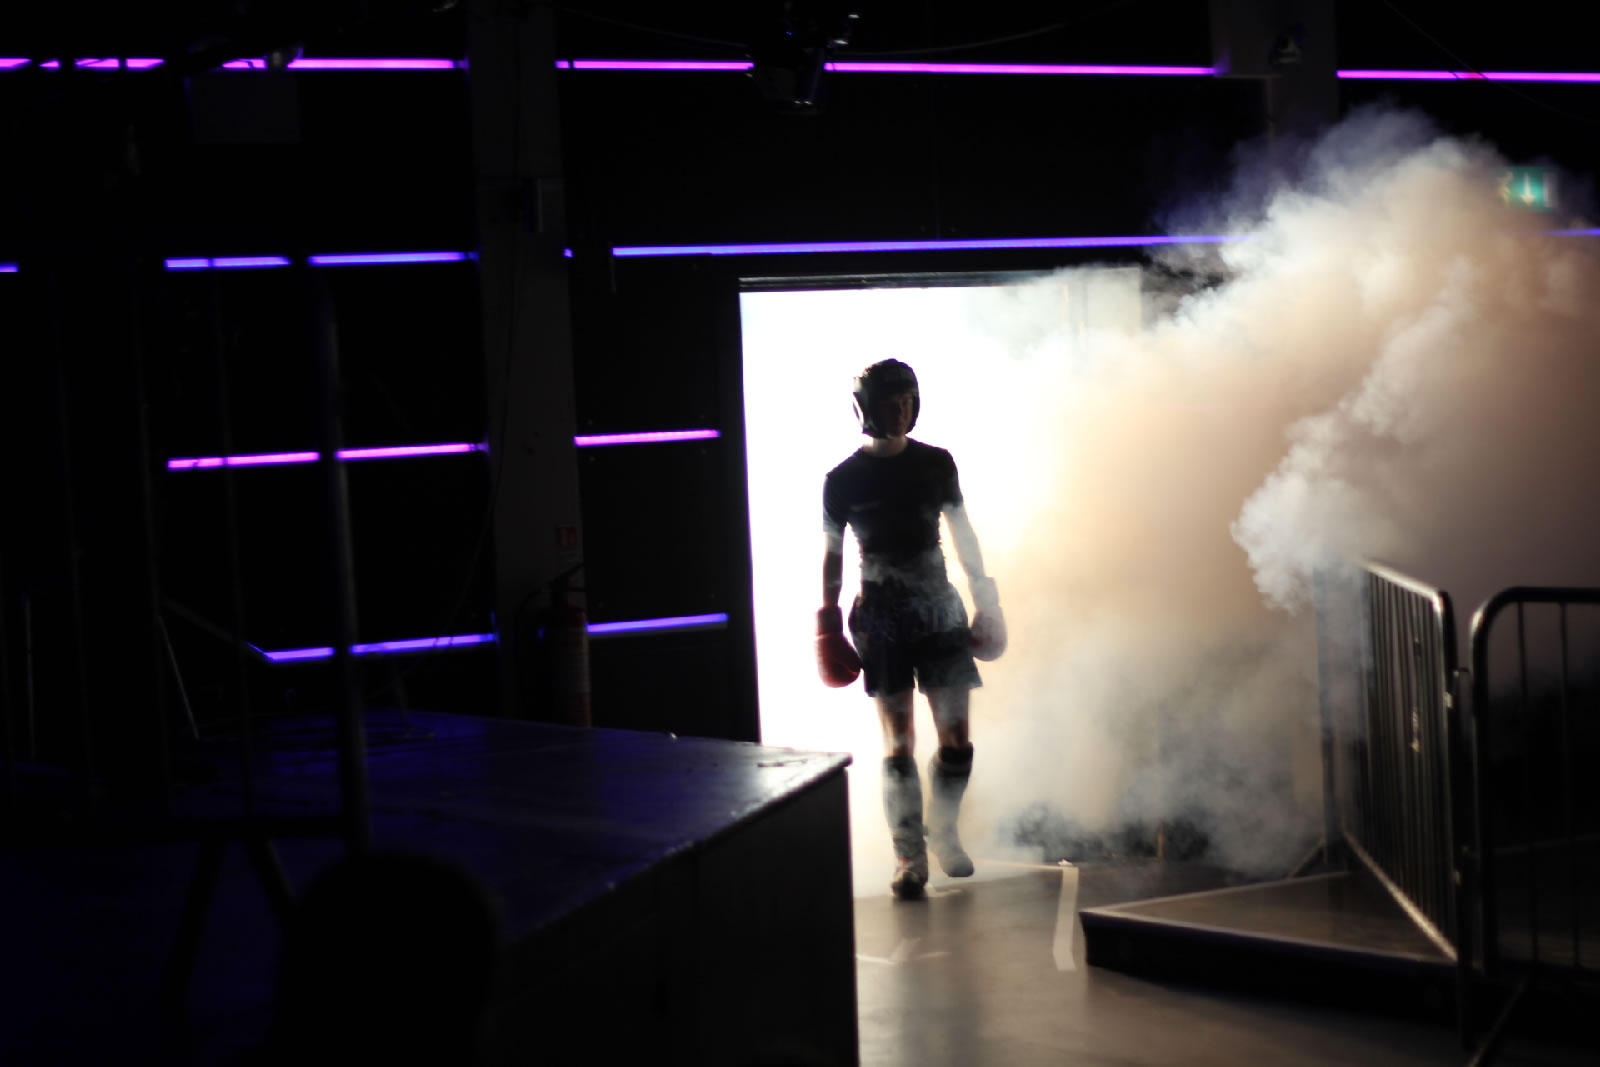
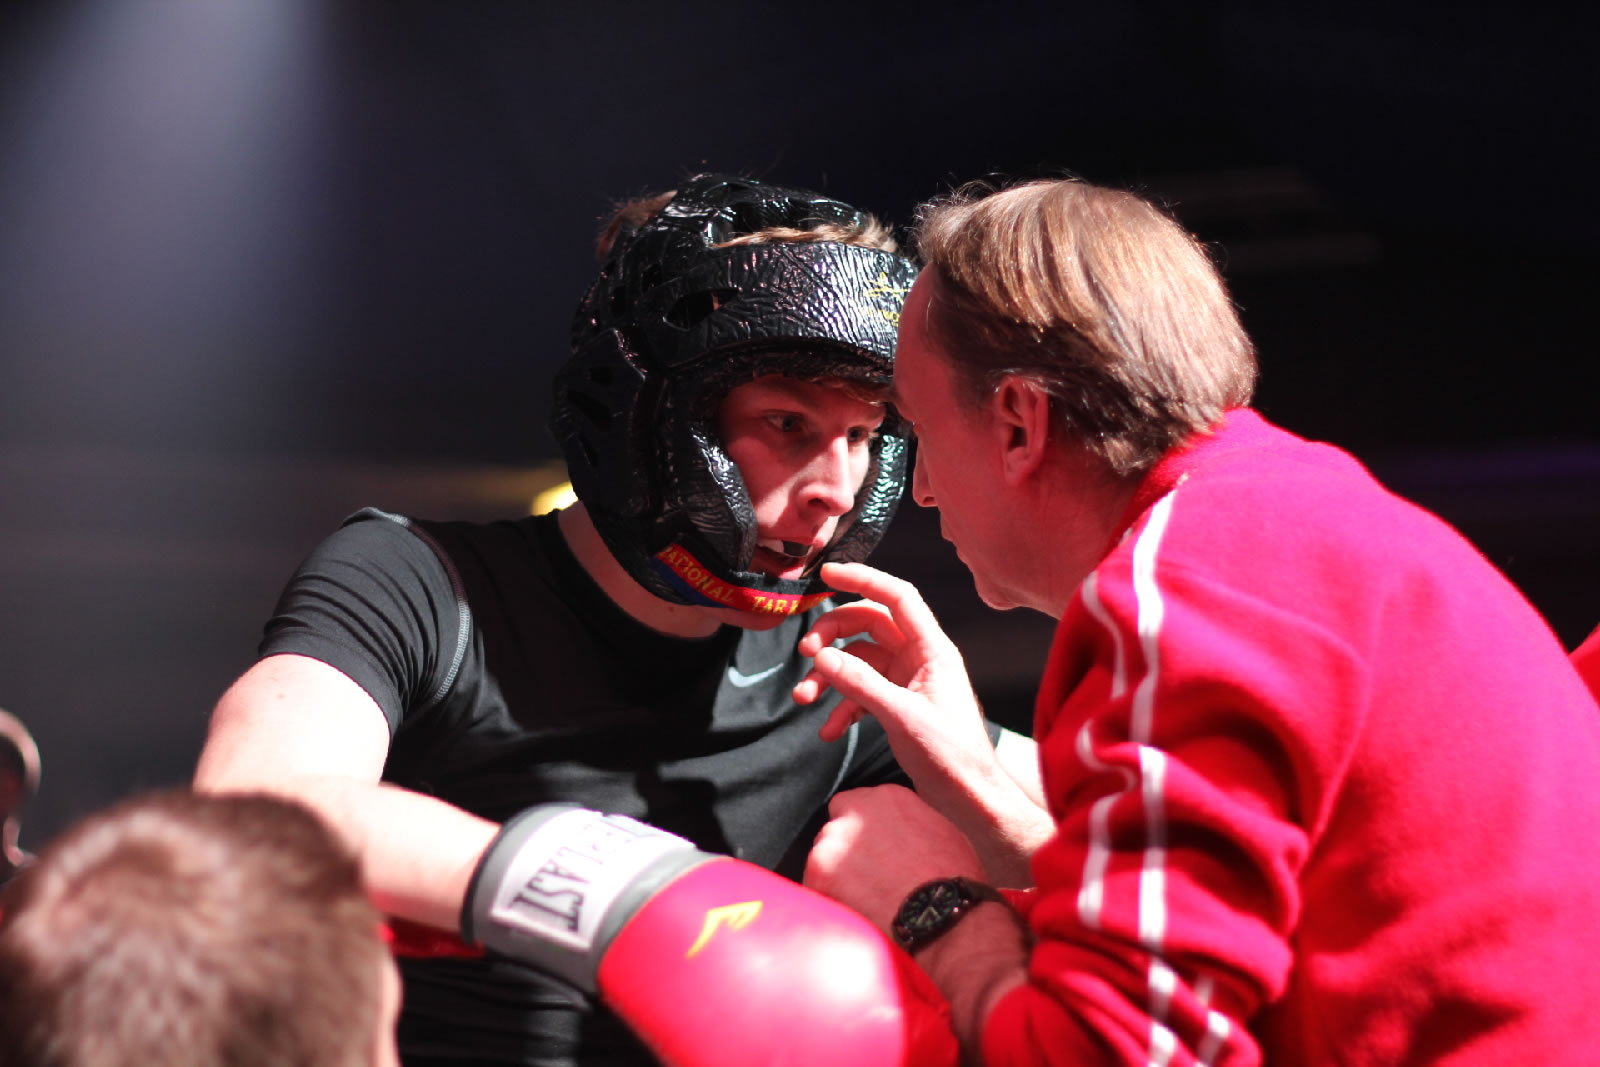
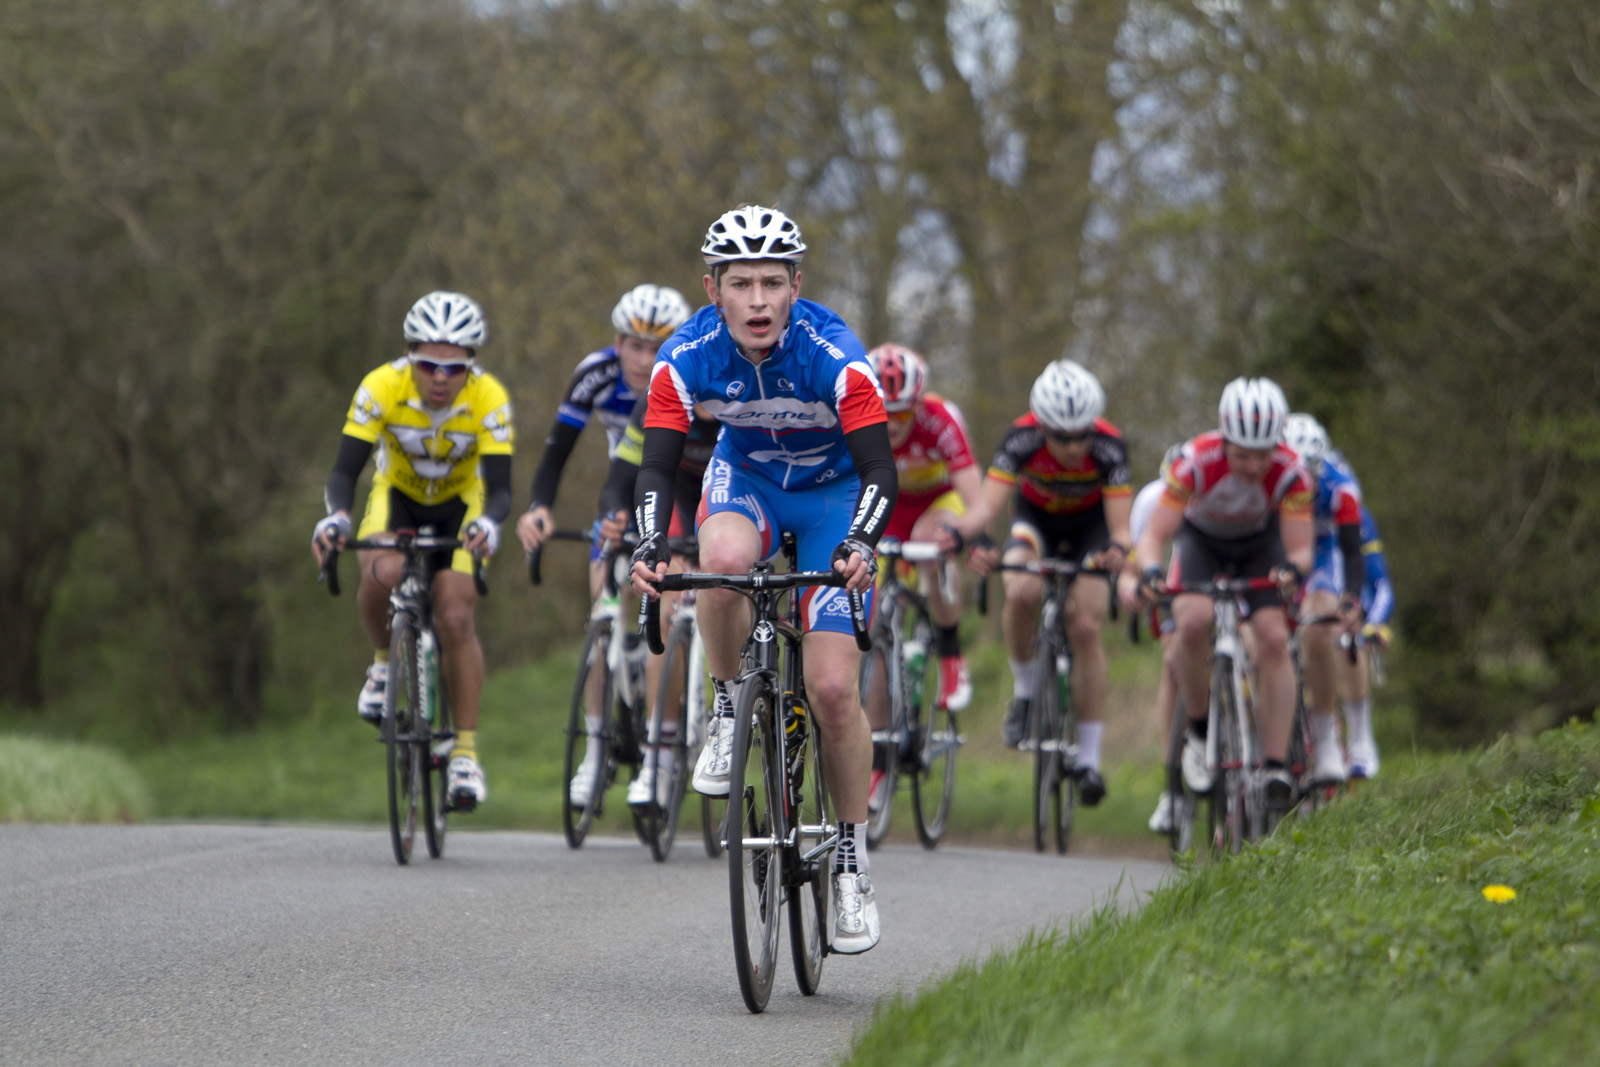
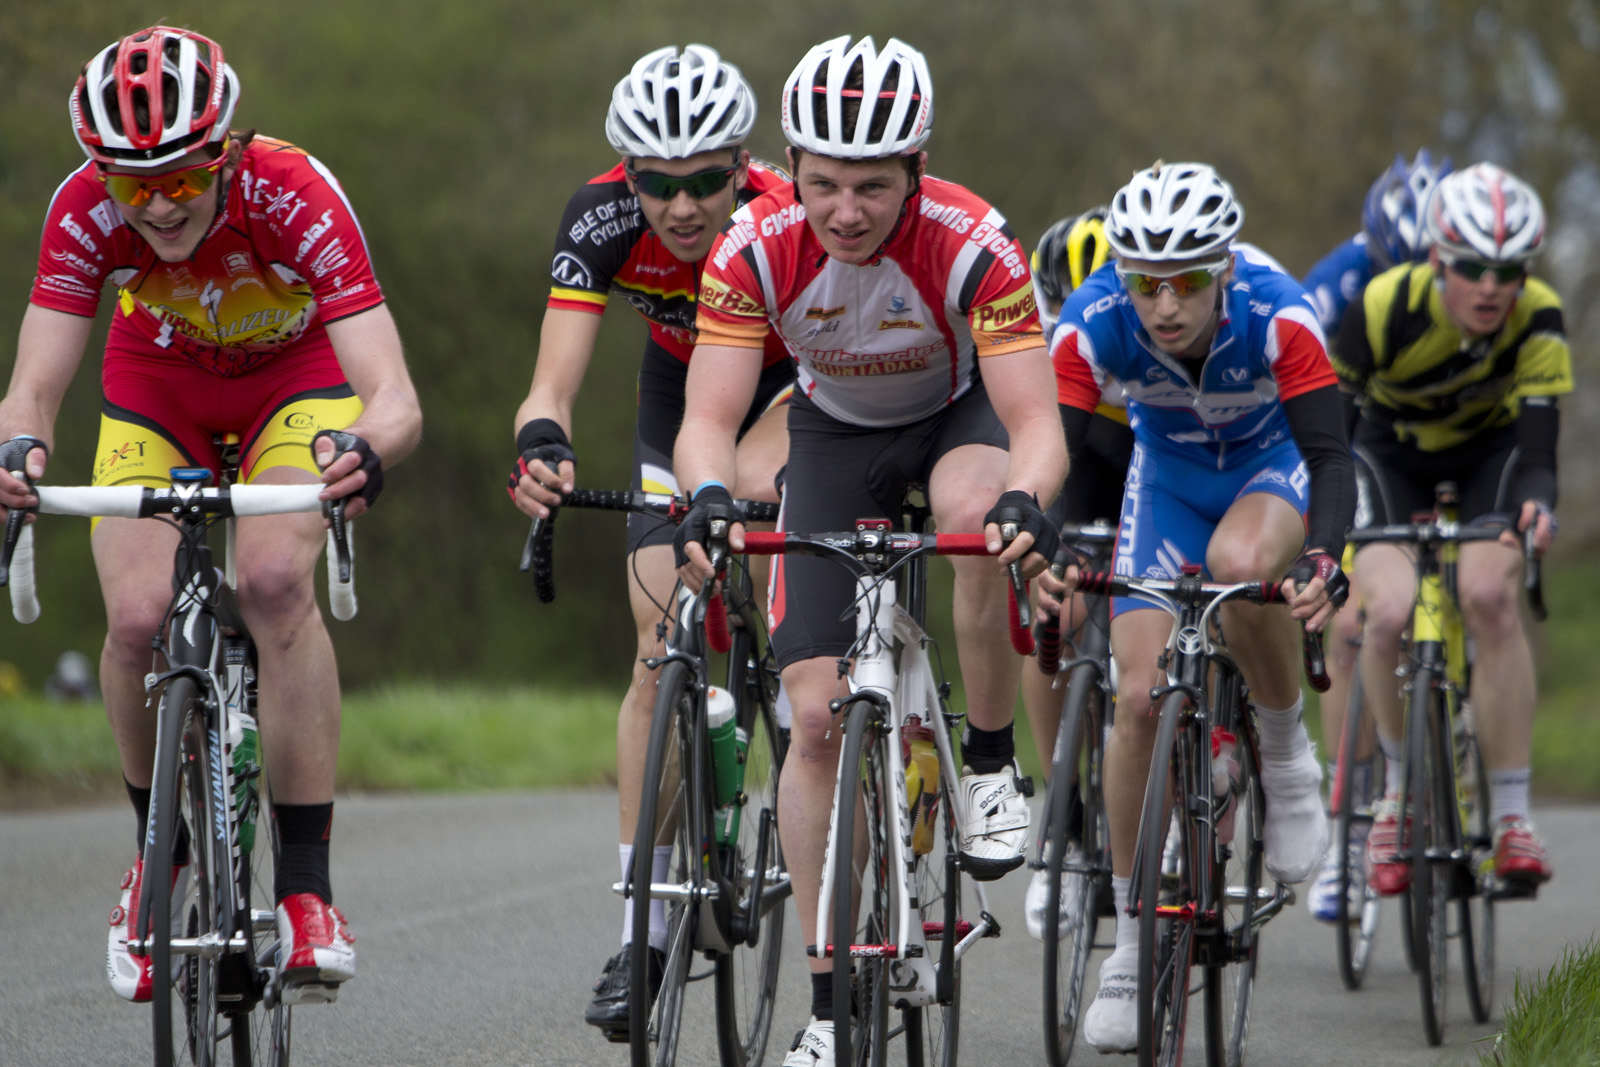
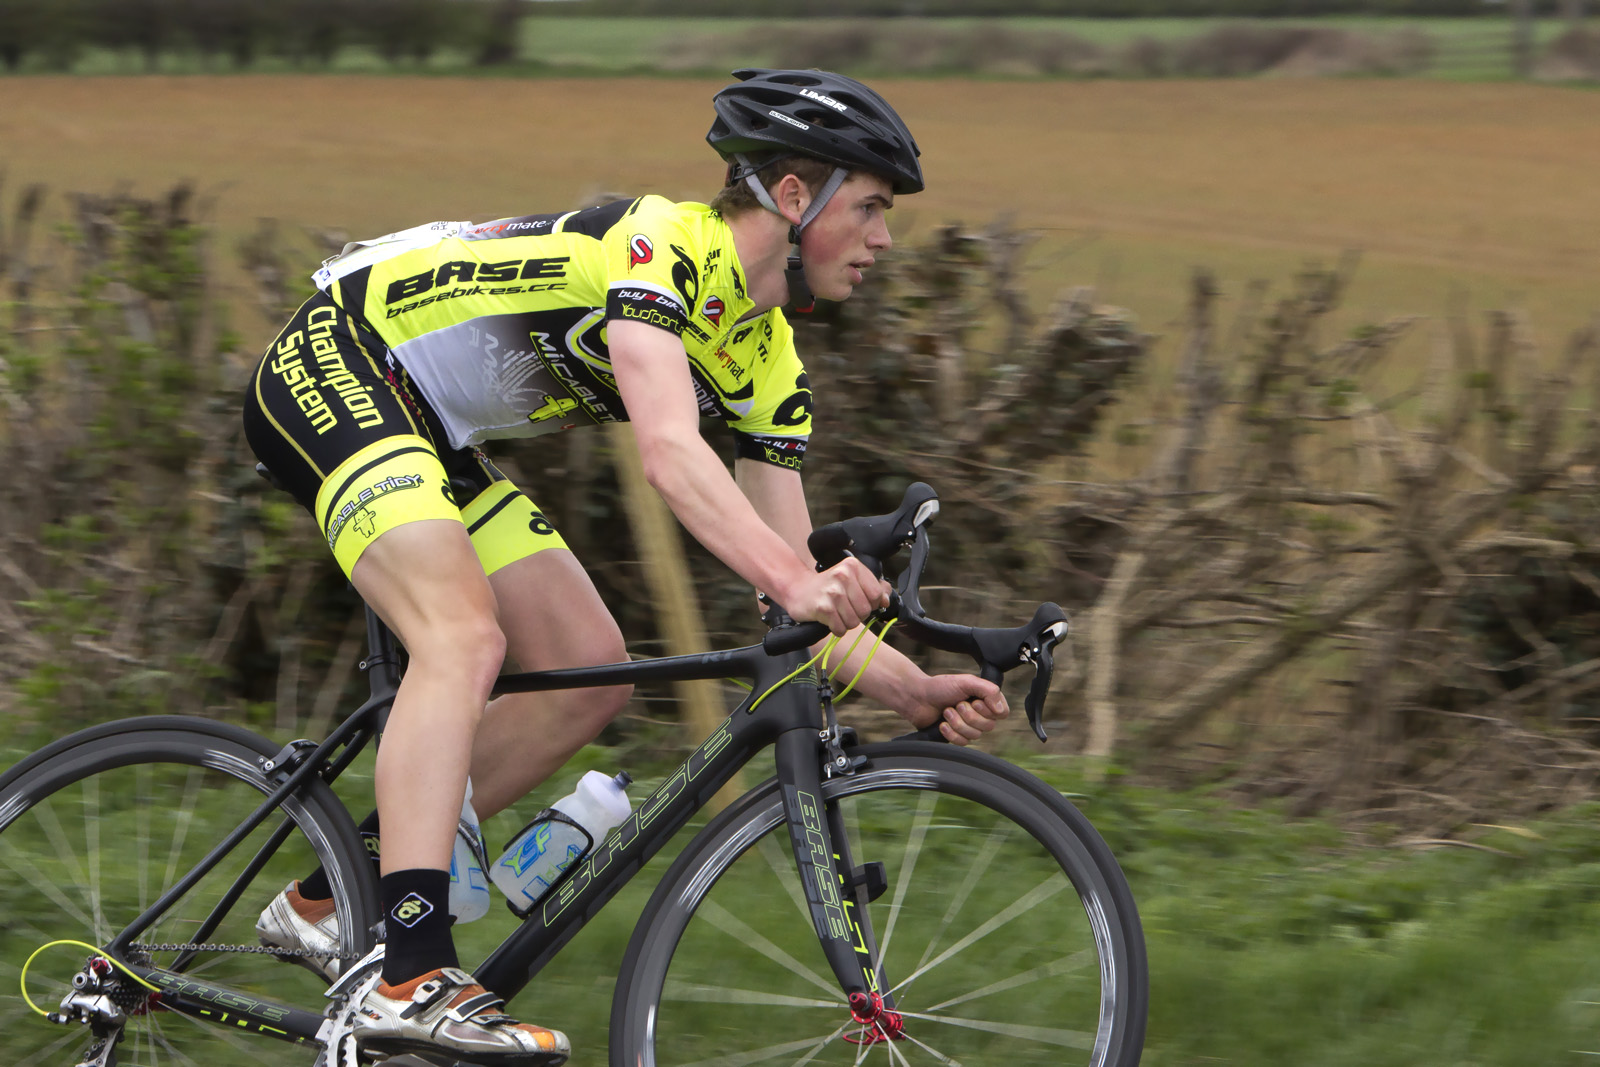
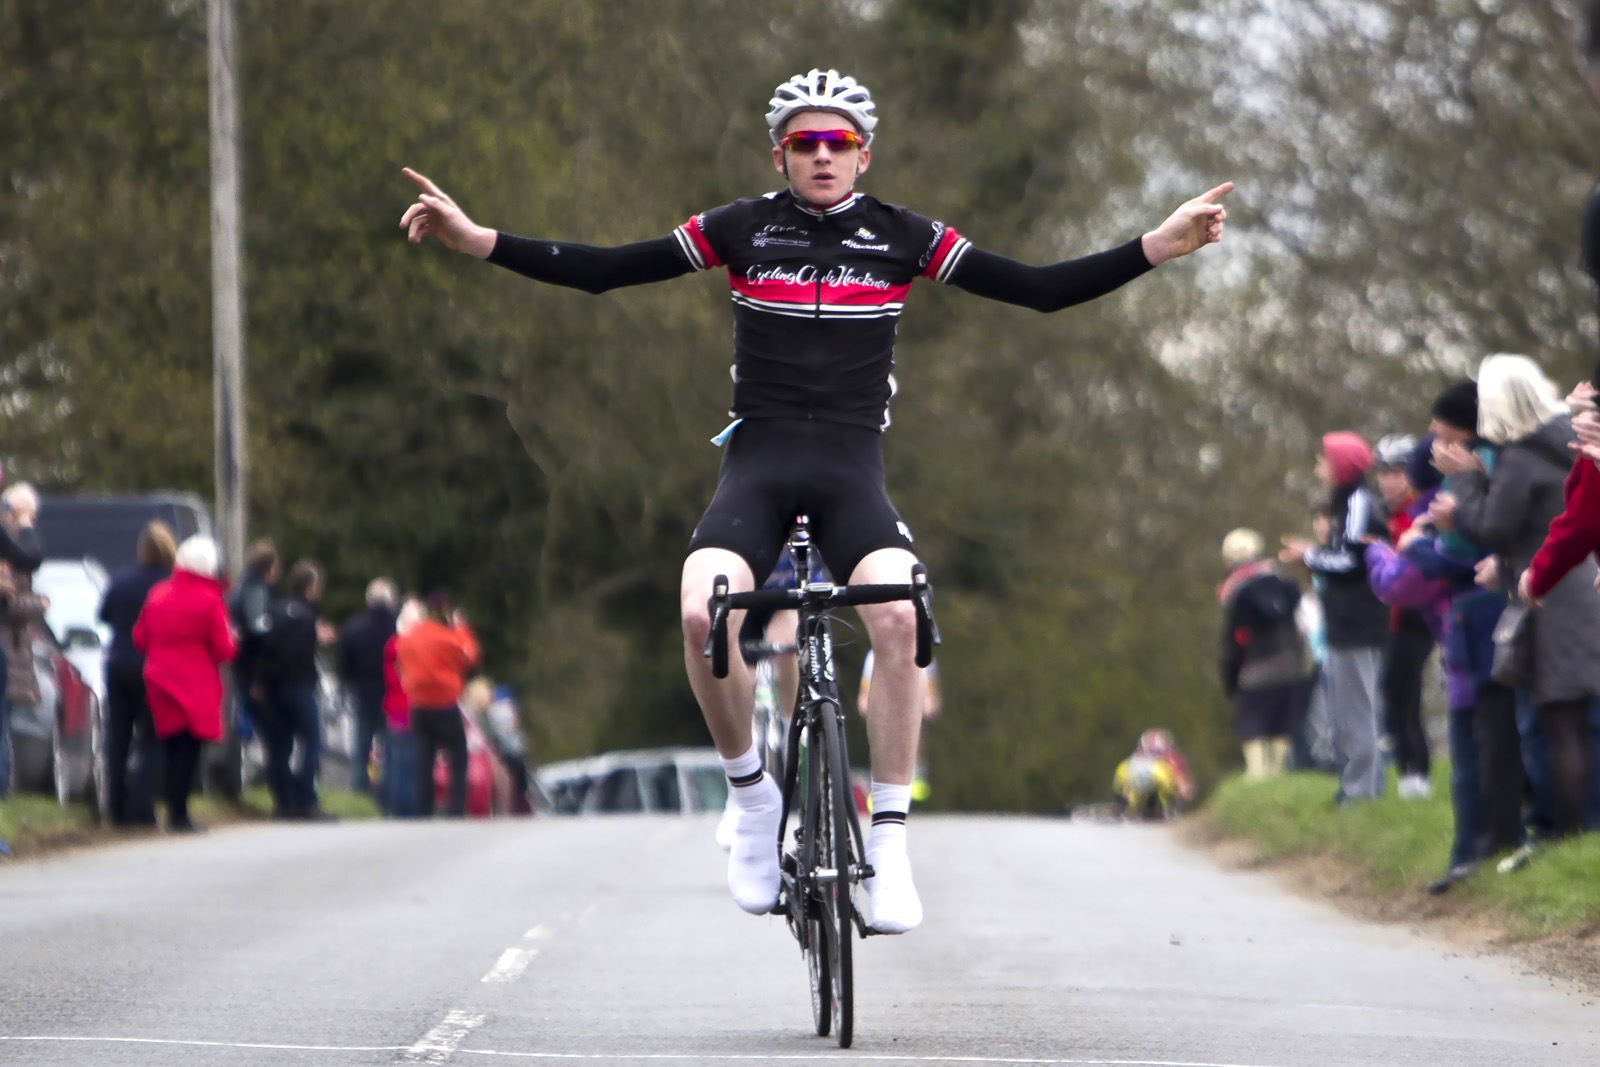
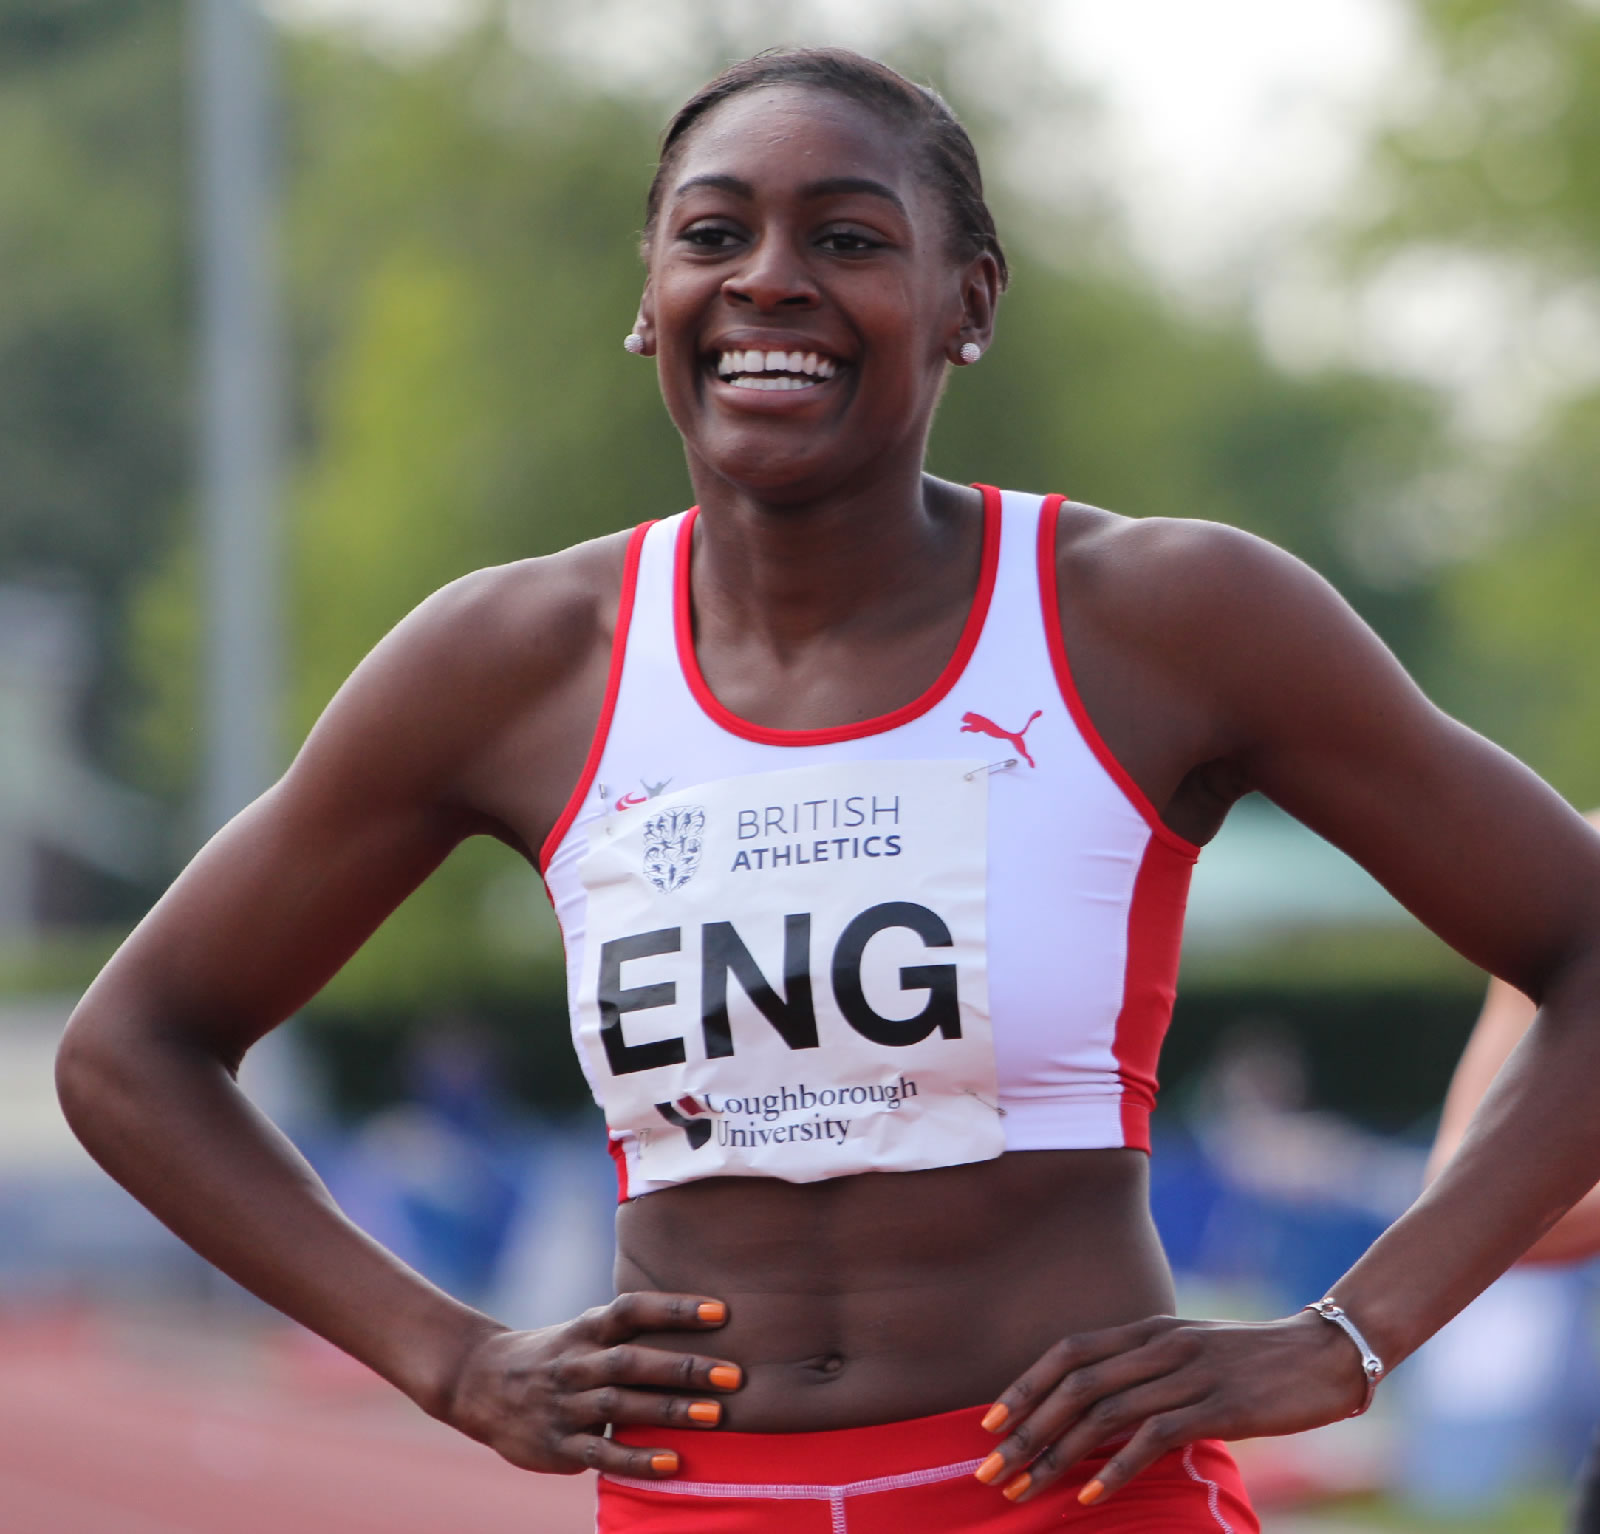
I’ve been taking photos of sports events, both as a hobby and also hired by organisers. Examples include the International Athletics, in Loughborough, which had a few olympian medalist as competitors. I also covered a few road bike races, and at that time I had set up a website to sell shots to competitors.

Charity set … Read more →
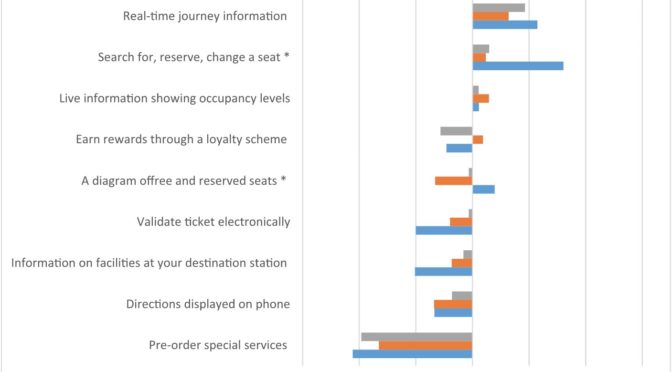
We are seeing the use of alternative approaches to measure user attitudes, specifically, those that offer more robust, useful and actionable attitudinal data. One of these methods is the Best-Worst Scaling (BWS), which has risen in popularity as a choice-based measurement approach. BWS experiments collect both “best” and “worst” information from a set of statements about the product or service offering. These could include attributes, features or product benefits. As such, more information is gathered about the top ranked and … Read more →

The Reflect Project was looking into ways to promote sustainable modes of transport such as walking and cycling instead of driving. … Read more →

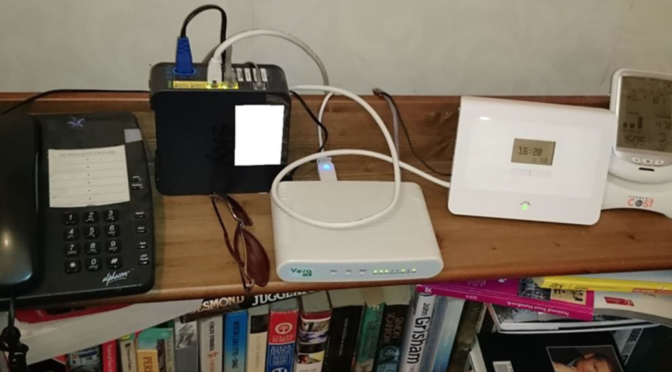
A few years ago I was working for a project evaluating smart home technology, comparing user expectations at the point of installation with experiences 1 year later. … Read more →
I was trying to make Microsoft Excel display sharp times on graphs, but took me a while to figure out how to. I had this graph of time to complete the task, per group of participants. The X axis displayed the participant group, and the Y axis corresponded to time. But as you can see on the example, instead of showing rounded times like 2, 5 or 10 minutes, Excel was showing fractions like 01:26, 2:53 etc. I would prefer … Read more →